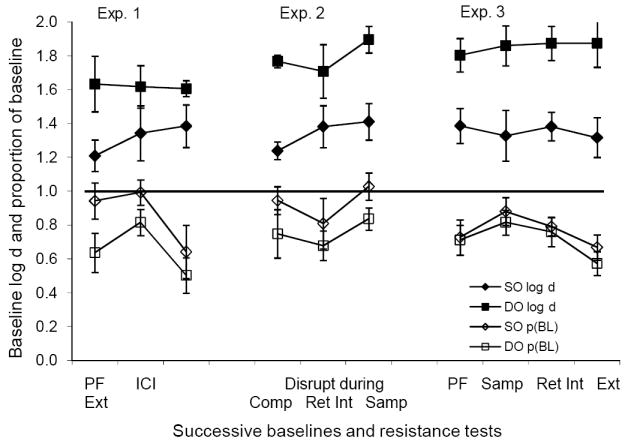
Fig. 14.

A summary of major results of all three experiments. The filled squares and diamonds give the average baseline values of log d in DO and SO components, respectively, and the unfilled squares and diamonds give the average values of proportions of baseline log d with the disruptors indicated on the x-axis. Range bars indicate standard errors.
