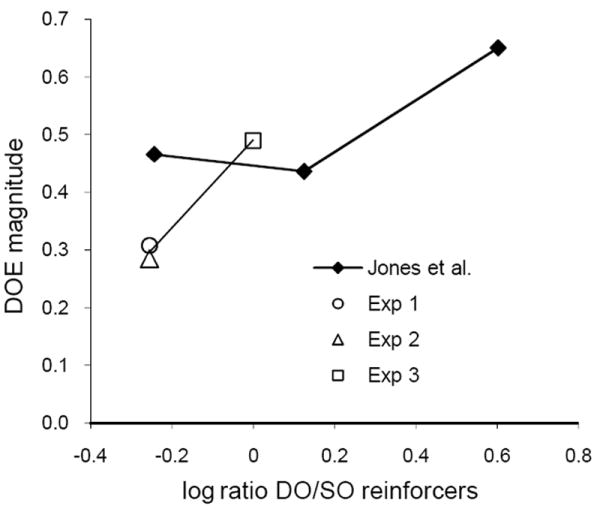
Fig. 15.

The magnitude of the DOE (i.e., the difference between average log d values with differential and nondifferential outcomes) as a function of the log ratio of total differential to nondifferential reinforcement. Filled diamonds present estimated differences for signaled differential and nondifferential trials in the study by Jones et al. (1995); see text for calculation. The unfilled symbols give average differences for the baseline conditions averaged within the present Experiments 1, 2, and 3.
