
Figure 3.
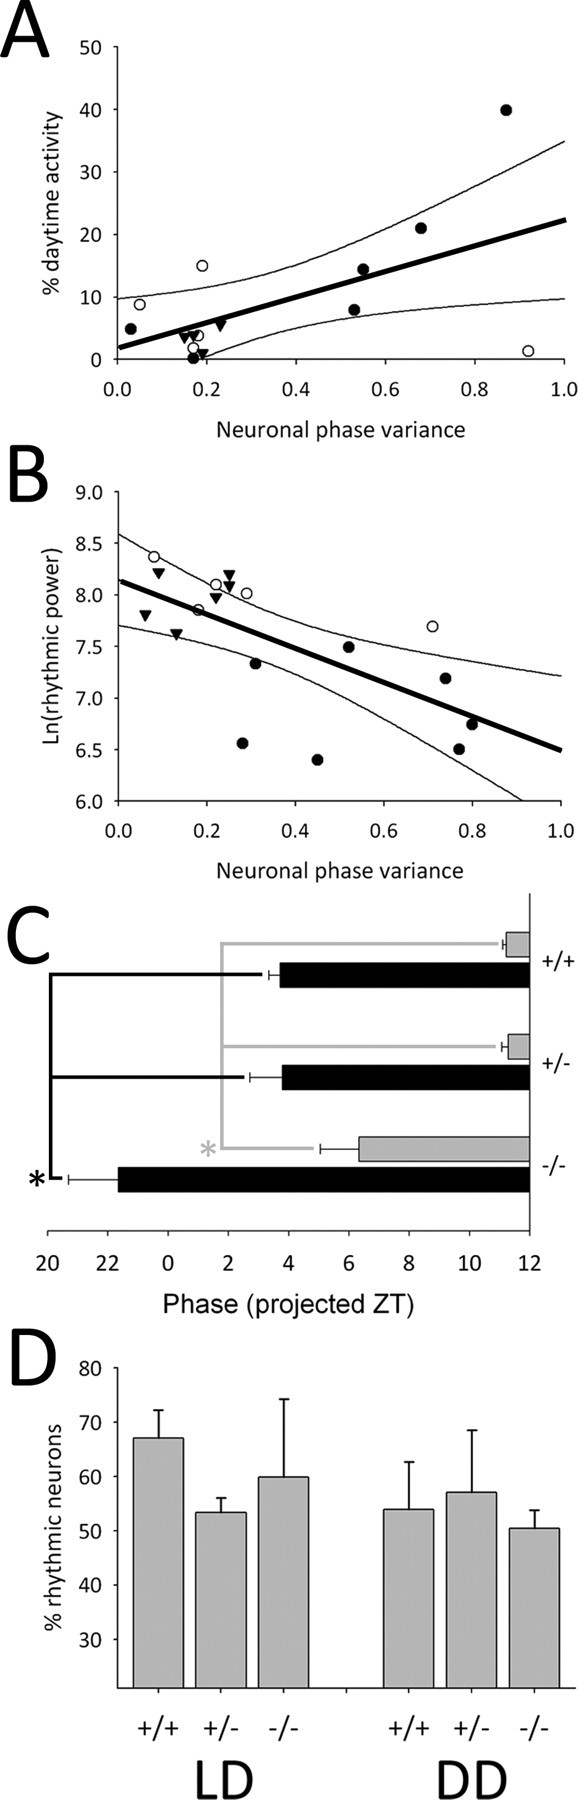
Correlation of SCN neuronal rhythms with behavioral characteristics. A, Plot of percentage of daytime wheel-running activity versus neuronal phase variance for individual mice (N = 15) by VIP genotype maintained in LD. B, Plot of rhythmic power versus neuronal phase variance for individual mice (N = 18) by VIP genotype maintained in DD. A, B, Closed circles represent VIP−/− mice, open circles represent VIP+/− mice and triangles represent VIP+/+ mice. Thick black line represents single order regression, and the thin black lines represent the 95% confidence interval. C, Phase of SCN Per1::GFP onset (10% rising phase) on the first day ex vivo from mice maintained in LD (black bars) and onset of behavioral activity on the first day in DD (gray bars). For number of animals, see Figure 1E and Figure 2F. D, Plot of the percentage of rhythmic neurons (2+ peaks) per SCN slice for mice maintained in LD (left) or in DD (right). LD: VIP+/+ (N = 5), VIP+/− (N = 5) and VIP−/− (N = 4); DD: VIP+/+ (N = 6), VIP+/− (N = 8) and VIP−/− (N = 7). Error bars represent SEM; *p < 0.05.