
Fig. 2.
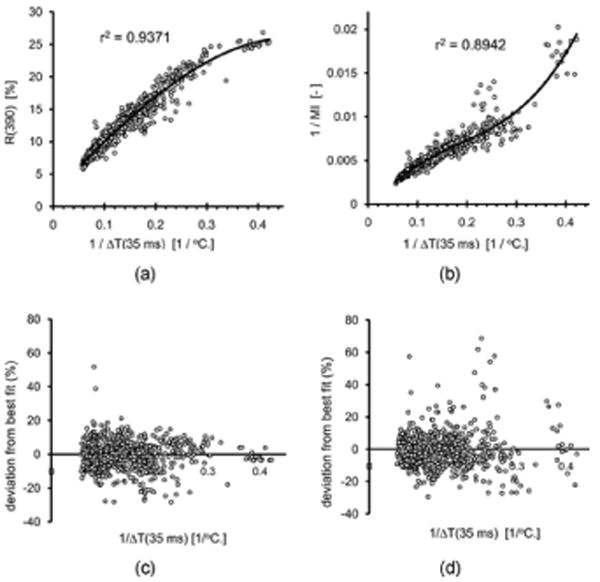
(a) Data of Fig. 1(b) plotted as reciprocal values (axes proportional to IMSRE). (b) Similarly plot for the mexameter. Relative deviations from fit lines are shown in (c) and (d), respectively, providing a measure for the IMSRE prediction accuracy.