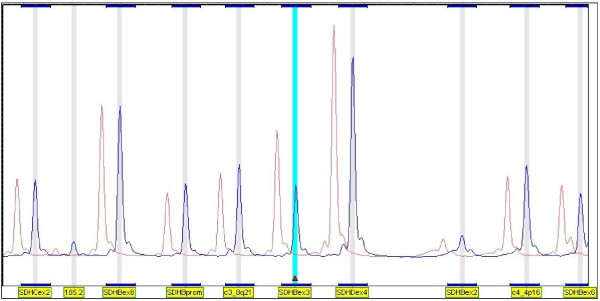
Figure 1.
An example of MLPA analysis of the SDHB, SDHC and SDHD genes. Only some exons of each gene can be seen in this view but all are included in the kit (P226 MLPA kit), plus the promoters of each gene, and several control fragments located on various chromosomes. Red peaks show the average of normal control DNA and blue peaks represent the DNA of the patient. The deletion of exon 3 of SDHB can clearly be seen (small red diamond).

