
Figure 5.
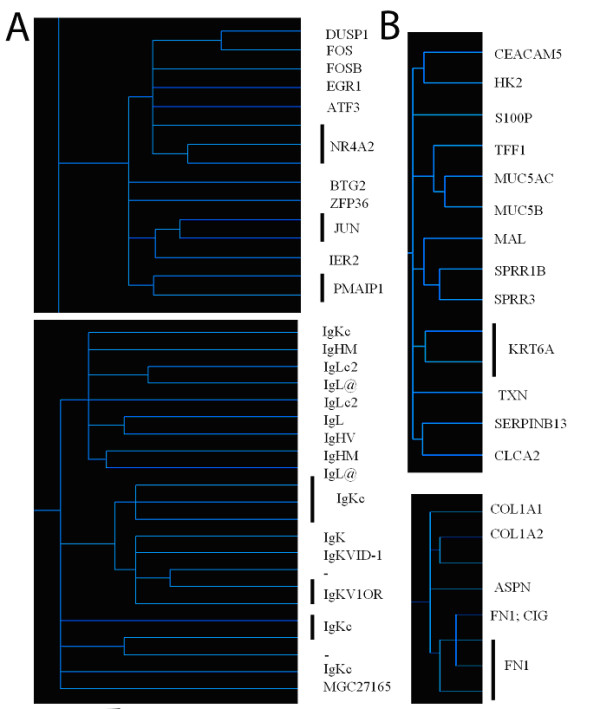
Hierarchical clustering analysis. Dendrograms were constructed using hierarchical clustering algorithms, performed on the subset of significantly changed genes. The shorter the length of the branches, the more co-expressed the members of the genes are. Magnified portions of the dendrograms showing the clusters of co-expression for genes down-regulated (A) and up-regulated (B) in primary pterygium relative to control. Note that the 2 clusters in A involved transcription factors and immunoglobulins, whereas 2 clusters in B were involved in structural proteins and extracellular matrix.