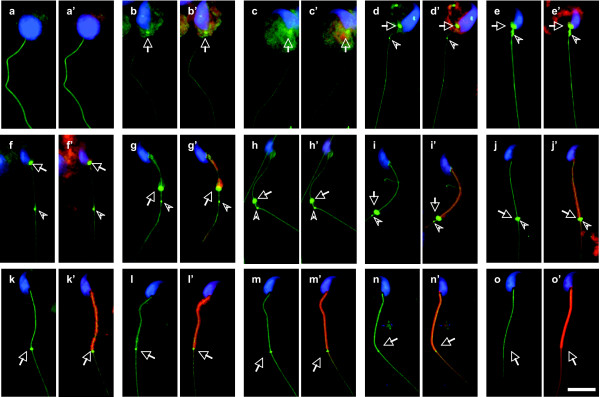
Figure 3.
Spatiotemporal progression of annular DNAJB13 during mouse spermiogenesis. The annular DNAJB13 staining (green, arrows) was first seen at the neck region of step 9 spermatids (b), not in step 8 spermatids (a), and the staining intensity increased until the annulus slipped down to its distal position at step 15 (c-i). With the formation and maturation of the mitochondrial sheath (red), the signal of annular DNAJB13 decreased gradually from middle step 15 to step 16 (j-n) and disappeared totally in mature spermatozoa (o). Note the DNAJB13 antibody also labeled a dot (arrowheads) below the annulus. This dot was first seen around step 13–14 (d) and migrated towards the midpiece-principal piece junction along the flagellum (e-j). The annulus followed and finally merged with the dot at the junction (j). The sperm nuclei were stained with DAPI (blue), while the mitochondria were stained with MitoTracker. (a-o) Merged images of DNAJB13 with DAPI; (a'-o') Merged images of DNAJB13, MitoTracker and DAPI. The scale bar represents 10 μm.

