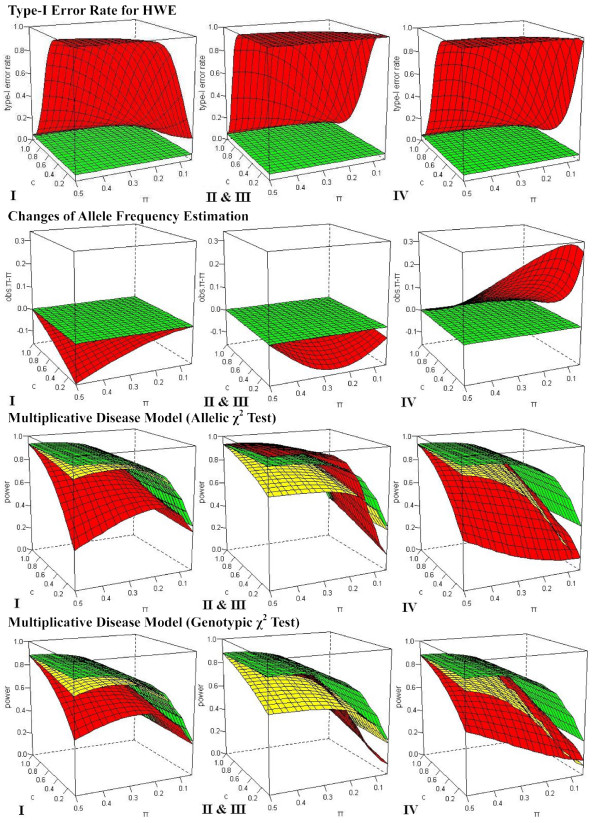
Figure 2.
Effects of MCB on HWE, MAF estimation and association studies under multiplicative disease model. The comparison was conducted among the null (printed in green), UBM (printed in yellow) and MCB (printed in red). The figures correspond to Scenario I, Scenario II & III and Scenario IV from the left to right with different extents of missing bias (0 ≤ c ≤ 1).

