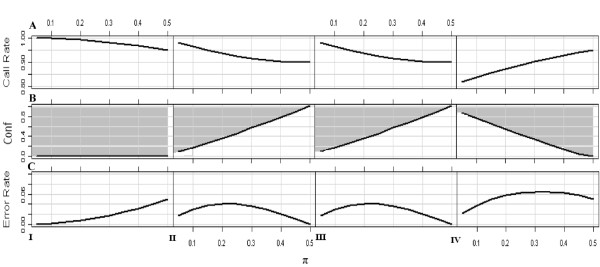
Figure 3.
Effects of MCB and genotyping errors on MAF estimation. A) illustrates the overall call-rate for the loci with different MAFs in the presence of MCB (c = 0.8). B) illustrates the threshold of conf by a solid line. If the equivocal observations can be called accurately in a confidence above the conf threshold, it prefers to call those equivocal ones at the cost of genotyping errors to minimize the biased estimation of MAF introduced by the equivocal observations (grey area above the line). Otherwise, 'no-call' procedure is beneficial, which results in MCB (area below the line). C) illustrates the genotyping error rate, when the equivocal observations are called in the conf threshold mentioned above. The figures correspond to Scenario I, Scenario II, Scenario III and Scenario IV from the left to right.

