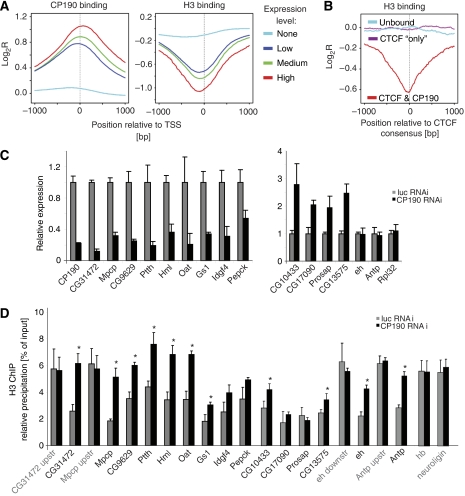
Figure 4.
CP190 is associated with depletion of histone H3. (A) Genes were grouped by expression levels (Muse et al, 2007) into highly (red, 256 genes), medium (green, 1640 genes), low (dark blue, 1389 genes) and not expressed genes (light blue, 3673 genes) and cumulative binding profiles for CP190 and H3 (Larschan et al, 2007) relative to a 2-kb window at the TSS are shown as averaged mean enrichment ratios. (B) CP190 binds to CTS with a lack of H3. H3 profiles were sampled over a 2-kb window at the CTCF consensus for three data sets (200 sites each): CTCF plus CP190 binding (red), CTS devoid of CP190 (purple) and control CTCF consensus sites lacking both, CTCF and CP190 (blue). (C) Expression changes of individual genes after CP190-specific RNAi knock-down in Drosophila S2 cells result in upregulation (right panel) as well as downregulation (left panel). Firefly luciferase RNAi and genes Antp, eh and Rpl32 that showed no change in expression after loss of CP190 were used as controls. ChIP with anti-histone H3 antibody was analysed for promoters of downregulated genes (see above and Supplementary Table II) or for upregulated genes and for not affected genes (D). The genes hb and neuroligin are not bound by CP190 nor is their expression changed after RNAi. Error bars indicate the standard error of the mean of four independent experiments (*P<0.05 as calculated from a two-tailed t-test).

