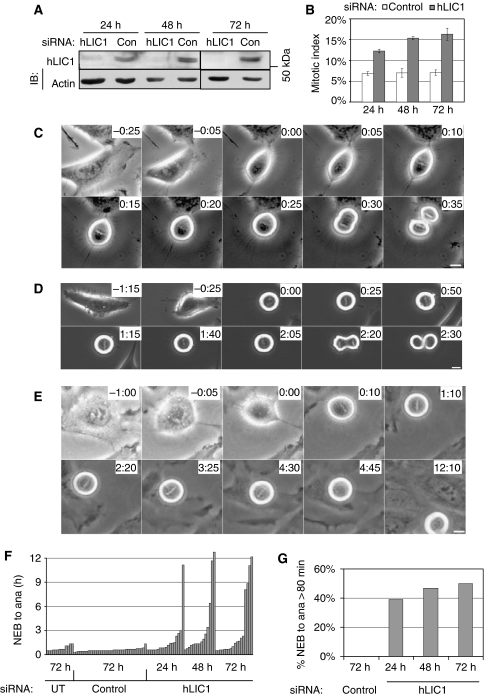
Figure 1.
LIC1-depleted cells delay in mitosis. (A) Immunoblot showing hLIC1 levels after treatment with control or hLIC1 siRNA for the indicated times. Actin, loading control; IB, immunoblot. (B) Mitotic index for control or hLIC1 siRNA-treated cells for indicated times (500–1000 cells were counted per bar, from three experiments). (C–E) Phase contrast images from time-lapse series. Control siRNA-treated Hela cell (C); hLIC1 siRNA-treated cell (D); hLIC1 siRNA-treated cell that did not initiate anaphase after 12 h but lost its metaphase plate (E, 4:30–4:45). 0:00 (h:min), bars, 10 μm. (F) Timing of individual cells (each bar) from NEB to anaphase onset (ana) under the indicated conditions. UT, untreated. (G) The percentage of mitotic cells that took >80 min (the longest control time) from NEB to ana (control: n=35 cells/bar, hLIC1: n=13–18 cells/bar) at the indicated times.

