Figure 7.
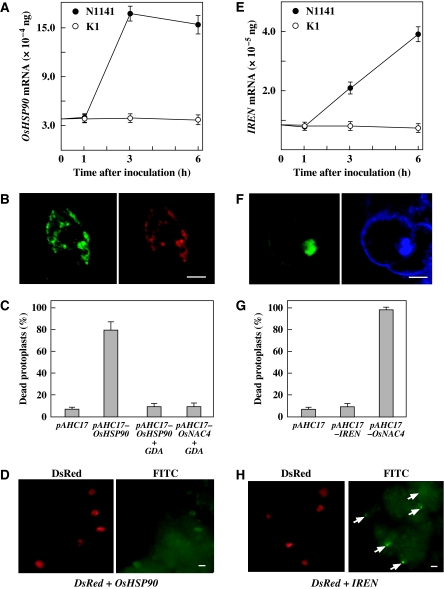
Contribution of OsHSP90 and IREN to HR cell death induction. (A) Time-course of OsHSP90 expression in cultured rice cells after inoculation with the avirulent N1141 strain (solid circles) or the virulent K1 strain (open circles) of A. avenae. The amount of OsHSP90 mRNA was measured by real-time RT–PCR. Each data point represents the average of three independent experiments. Bars indicate the standard errors. (B) Subcellular localization of GFP-fused OsHSP90. GFP-fused OsHSP90 expression vector and DsRed-fused AtbZIP28 (which is known to be efficiently delivered into ER: Tajima et al, 2008) cotransformed to cultured rice cells. The left panel represents GFP cell images, whereas the right panel displays DsRed images. Bar represents 10 μm. (C) Cell death in protoplasts transfected with pAHC17 alone (control) or pAHC17-OsHSP90 and pAHC17-OsNAC4 in the presence and absence of GDA. Protoplasts were treated with GDA concurrently to transfection. Twelve hours after transfection, dead protoplasts were scored using a light microscope. Y-axis values represent the percentage of dead cell relative to the number of transfected protoplasts. Each data point represents the average of three independent experiments. Bars indicate the standard errors. (D) DNA fragmentation was detected by TUNEL in cultured rice cells cotransformed with OsHSP90 and DsRed. The left panel represents DsRed cell images, whereas the right panel displays FITC images. Bar represents 10 μm. (E) Time-course of IREN expression in cultured rice cells after inoculation with the avirulent N1141 strain (solid circles) or the virulent K1 strain (open circles) of A. avenae. The amount of IREN mRNA was measured by real-time RT–PCR. Each data point represents the average of three independent experiments. Bars indicate the standard errors. (F) Subcellular localization of GFP-fused IREN. The left panel represents GFP cell images, whereas the right panel displays DAPI staining images. Bar represents 10 μm. (G) Cell death in protoplasts transfected with the pAHC17 (control), pAHC17-IREN and pAHC17-OsNAC4 vectors. Twelve hours after transfection, dead protoplasts were scored using a light microscope. Y-axis values represent the percentage of dead cell relative to the number of transfected protoplasts. Each data point represents the average of three independent experiments. Bars indicate the standard errors. (H) DNA fragmentation was detected by TUNEL in cultured rice cells cotransformed with IREN and DsRed. The left panel represents DsRed cell images, whereas the right panel displays FITC images. The arrow indicates a TUNEL-positive nucleus. Bar represents 5 μm.

