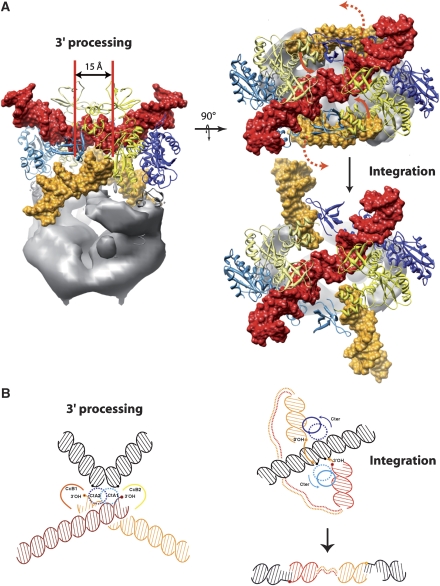
Figure 5.
Model for DNA integration. (A) The distance of 15 Å (5 bp) corresponds to the integration distance of the viral DNA (yellow) in the target DNA (red). The red arrows represent the movement of the viral DNA towards the integration intermediate structure. (B) Sketch showing the relative positions of the DNA molecules for the 3′ processing and integration reactions (the target DNA is in black and the viral DNA in orange and red). The integration reaction, which takes place through a nucleophilic attack by the 3′OH end on a 5′ phosphate of the target DNA, requires the displacement of the integrase C-terminus together with the viral DNA.

