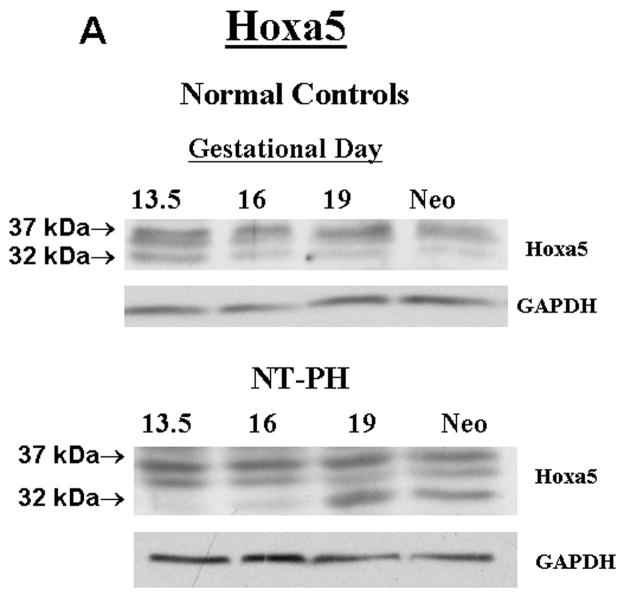
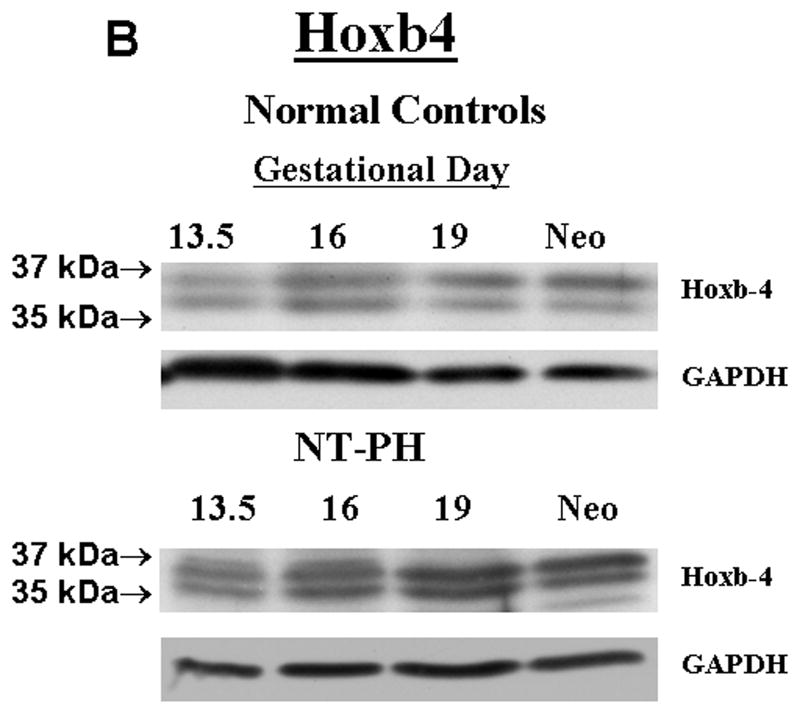
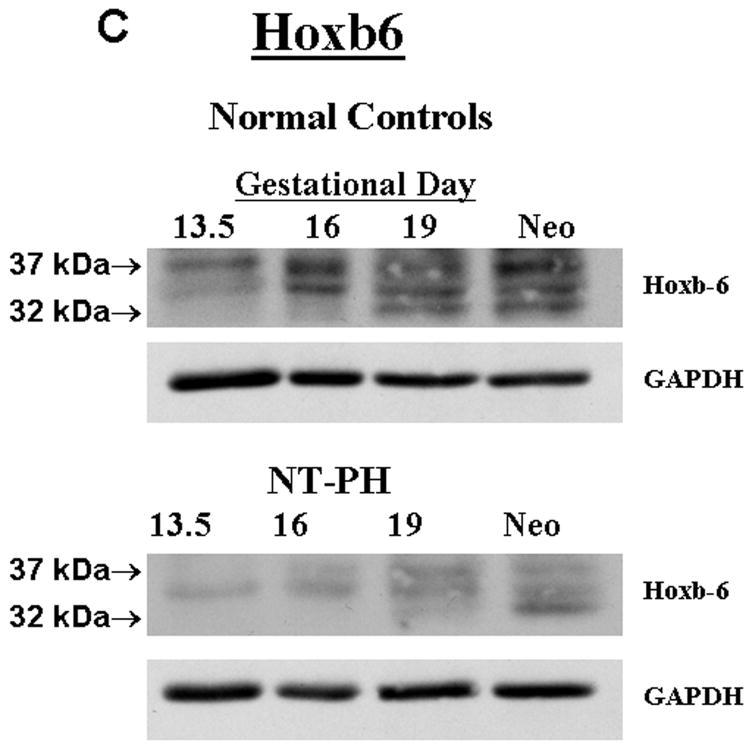
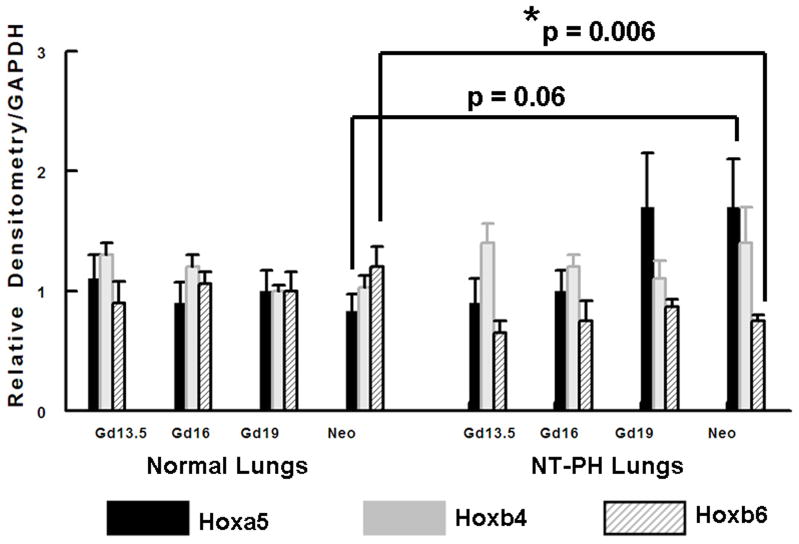
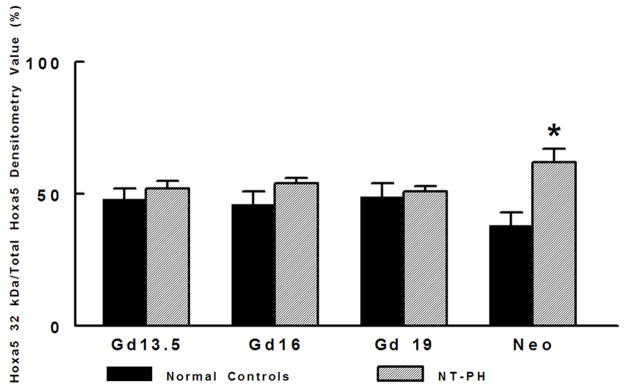
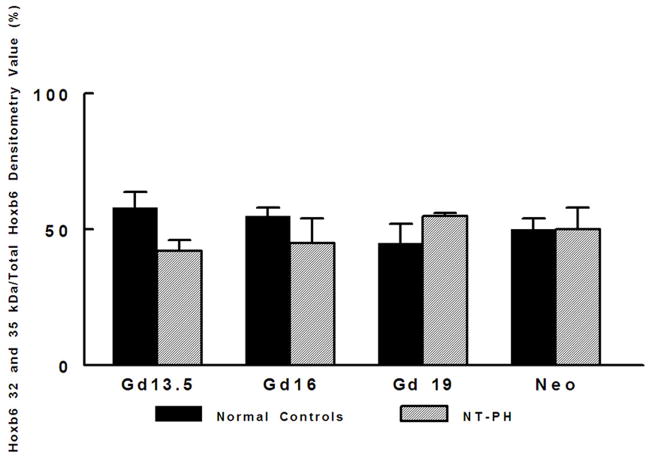
Figure 1. Hoxa5, Hoxb4 and Hoxb6 western blots and densitometric protein levels in normal and NT-PH lungs.
As shown by representative western blots, Hoxa5 (A), Hoxb4 (B), and Hoxb6 (C) were each detected as a cluster of three protein bands at approximate molecular weights of 32–37 kDa. Summary densitometry analysis on the cluster of protein isoforms detected for each Hox protein (from five separate blots for each protein from five experiments) is shown in (D). Densitometry of the lower molecular weight protein isoforms are shown for Hoxa5 (E) and Hoxb6 (F). Prior to Gd19, normal lung (D, left side of graph) had higher Hoxa5 and Hoxb4 than Hoxb6 followed by higher Hoxb6 compared to Hoxa5 and Hoxb4 after Gd19. This change in relative protein levels of Hoxa5, Hoxb4 and Hoxb6 did not occur in NT-PH lungs (D, Right side of graph) with Gd19 and Neo protein levels of these three Hox proteins resembling an exaggerated pattern to that seen in earlier stages of lung development. Compared to normal lungs, Gd19 and neonatal NT-PH lungs showed a trend towards increased Hoxa5 protein by at least 40% (p=0.06, N=5, Mean ± SEM) and in neonatal lungs, a similar increase of Hoxb4 by 40%. Neonatal NT-PH lungs had a significant decrease in Hoxb6 by 45% (*p = 0.006, N = 5, Mean ± SEM, Neo normal control verses Neo NT-PH). When evaluating changes in the smaller protein isoforms identified for Hoxa5 and Hoxb6, the 32 kDa isoform for Hoxa5 (E) contributed to a significant increase in the total protein levels of Hoxa5 in neonatal NT-PH lungs compared to normal controls (*p = 0.004, N = 5, Mean ± SEM, Neo NT-PH lungs verses Neo normal controls) whereas the relative proportion of densitometric signal for the smaller bands for Hoxb6 (F) was only slightly increased with advancing gestation in NT-PH lungs.

