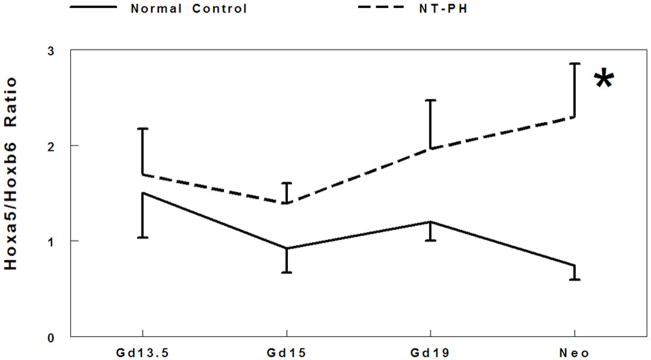
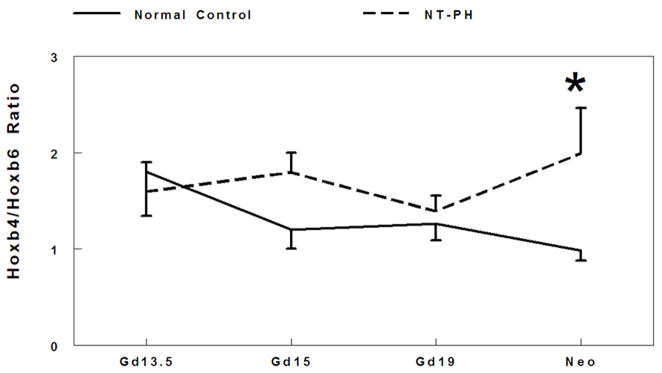
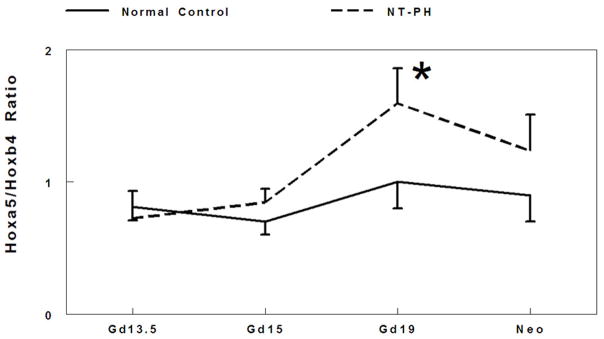
Figure 2. Ratio of Hoxa5 to Hoxb6, Hoxb4 to Hoxb6, and Hoxa5 to Hoxb4 protein levels.
Densitometry analysis showed that Hoxa5 to Hoxb6 ratio (A) gradually decreased throughout gestation in normal controls. However in NT-PH lungs, Hoxa5 to Hoxb6 ratio increased throughout gestation and was significantly increased in neonatal NT-PH lungs (*P<0.05, N=5, Mean ± SEM, Neo normal controls verses Neo NT-PH). On or before Gd19, Hoxb4/Hoxb6 ratio (B) was not different in normal verses NT-PH lungs but became significantly greater in neonatal NT-PH lungs (*P<0.05, N=5, Mean ± SEM, Neo normal controls verses Neo NT-PH). Normal lung Hoxa5 to Hoxb4 ratio (C) was unchanged across gestation but significantly elevated in Gd19 NT-PH lungs compared to normal controls (*P<0.05, N=5, Mean ± SEM, Gd19 Normal Controls verses Gd19 NT-PH).


