
Figure 1.
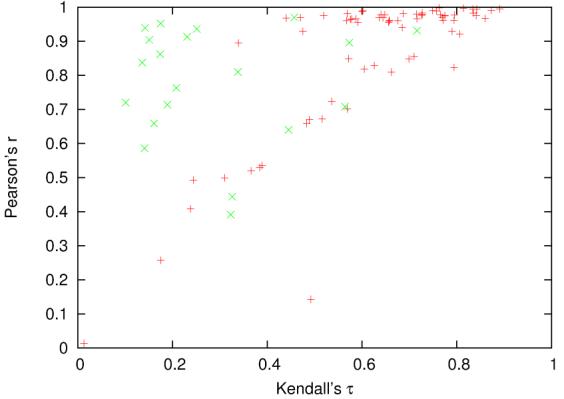
Each point corresponds to a target in benchmark B. The Pearson's r and Kendall's τ are computed from the Pcons MQA. The green points (x) are the 20 assessments with most ties, which inflates the values of Pearson's r.
Official websites use .gov
A
.gov website belongs to an official
government organization in the United States.
Secure .gov websites use HTTPS
A lock (
) or https:// means you've safely
connected to the .gov website. Share sensitive
information only on official, secure websites.
Each point corresponds to a target in benchmark B. The Pearson's r and Kendall's τ are computed from the Pcons MQA. The green points (x) are the 20 assessments with most ties, which inflates the values of Pearson's r.