
Figure 10.
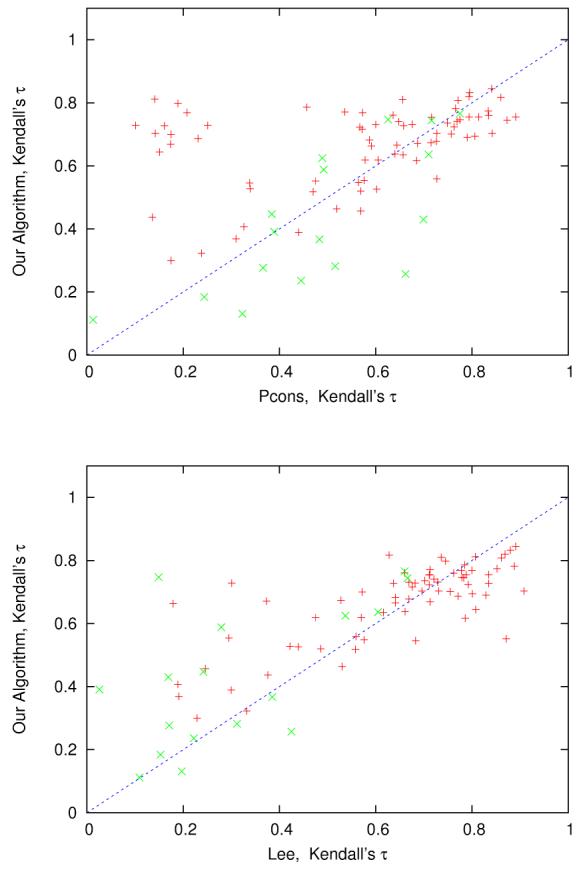
Each point corresponds to a target in benchmark B. Here we show average Kendall's τ using our algorithm (constraints extracted from models) vs. Pcons and the Lee algorithm. Easy targets (marked with red +) correspond to template-based targets and hard targets (marked with green ×) correspond to template-free models using the CASP7 classification.