
Figure 11.
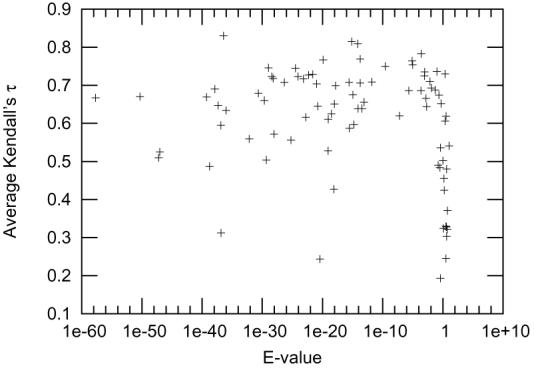
Each point corresponds to a target. The lowest E-value of any template for the target is shown on the x-axis and the Kendall's τ of the models is shown on the y-axis.
The two outliers are T0379 (4E-21,0.244) and T0375 (1.4E-37,0.312). Both targets had many templates and good models from many servers, so that getting a high correlation with quality requires detecting fairly small differences between models. There appear to be two sets of models for both targets (one using a good template and one using a poorer template), with high correlation between the MQA measure and GDT within each set, but without clean separation of the sets.