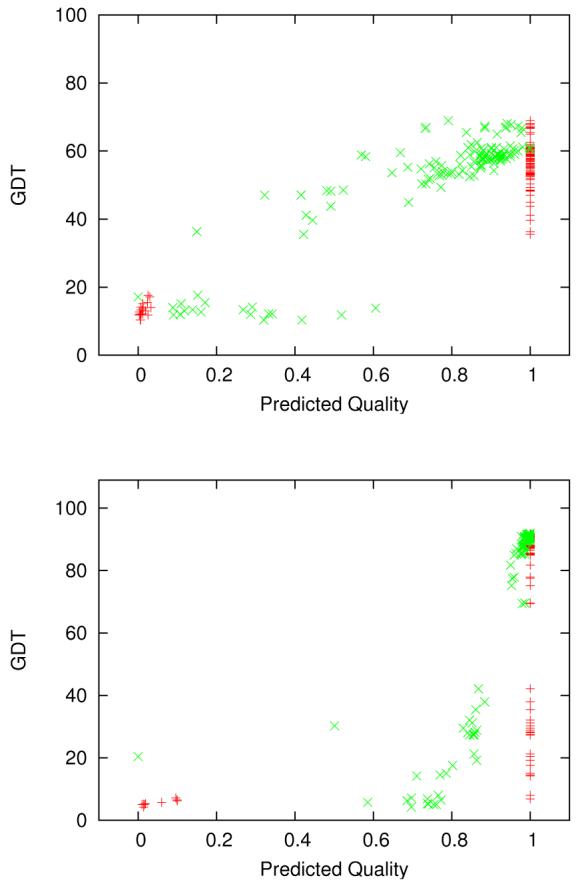
Figure 3.

Different MQAs for complete server models of targets T0370 (upper) and T0334 (lower). The set of red points (+) is the MQA from the topranked group (634, Pcons) at CASP7 and the set of green points (X) is our MQA. The correlation values for the assessments in the Figure are: T0370 (+): r=0.94, τ=0.25, ρ=0.60. T0370 (X): r=0.89, τ=0.61, ρ=0.79. T0334 (+): r=0.59, τ=0.14, ρ=0.45. T0334 (X): r=0.54, τ=0.72, ρ=0.90. Evaluations using Pearson's r would slightly prefer the Pcons MQA even though it clearly is not what we expect of a good MQA. However, Kendall's τ and Spearman's ρ are much higher for our assessments, because they do much better rankings of the models.
