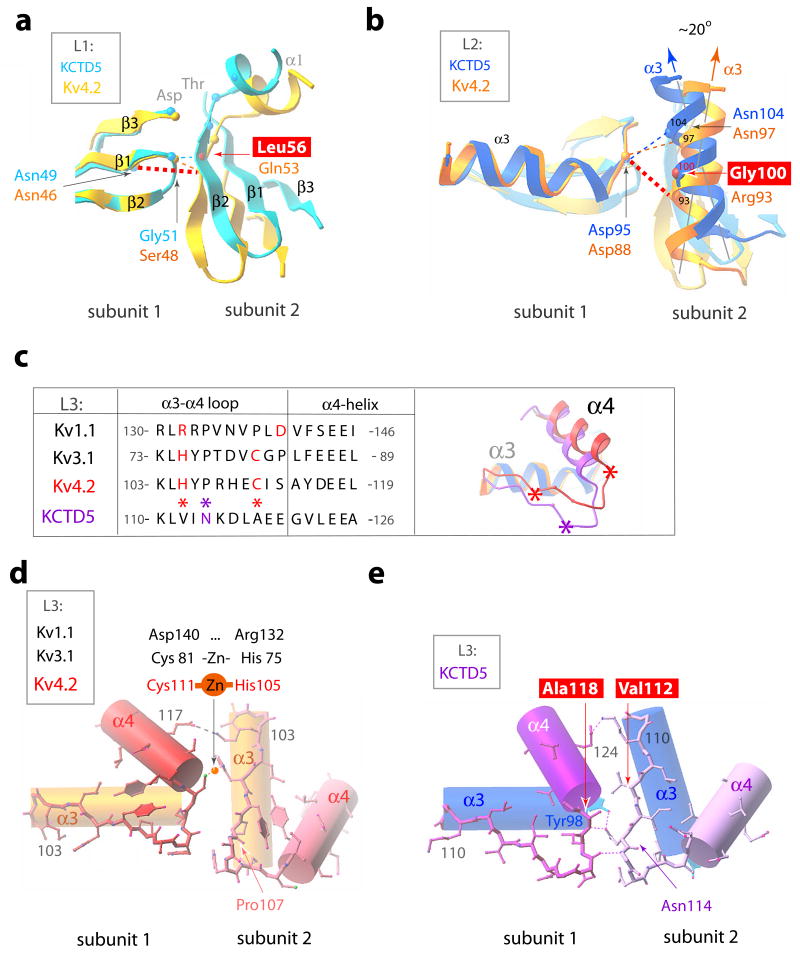
Figure 7. BTB intra-molecular interactions in KCTD5 and T1 domains.
KCTD5 (high-salt) and Kv4.2 (PDBid 1NN7) structures are shown in the color scheme of Fig. 6. H-bonds indicated as dashed lines. Four key residue differences between the KCTD5 and T1 interfaces are boxed.
a. BTB L1. Interacting residues shown as small spheres at the Cα-atoms. The view is perpendicular to the image in Fig. 6c.
b. BTB L2. Presentation as in panel a. The ~20° difference in orientation of α3-helix axes of KCTD5 and Kv4.2 is indicated.
c. BTB L3 sequence alignment and ribbon presentation for KCTD5 and Kv4.2 viewed from top. Val112, Ala118 and Asn114 in KCTD5 are marked with asterisks.
d. BTB L3 in Kv4.2 α3- and α4 helices are shown as cylinders and the α3-α4 loop in ball-and-stick mode. Arg108 side chain omitted for clarity.
e. BTB L3 in KCTD5. Representation as in d. Lys115 side chain omitted for clarity.

