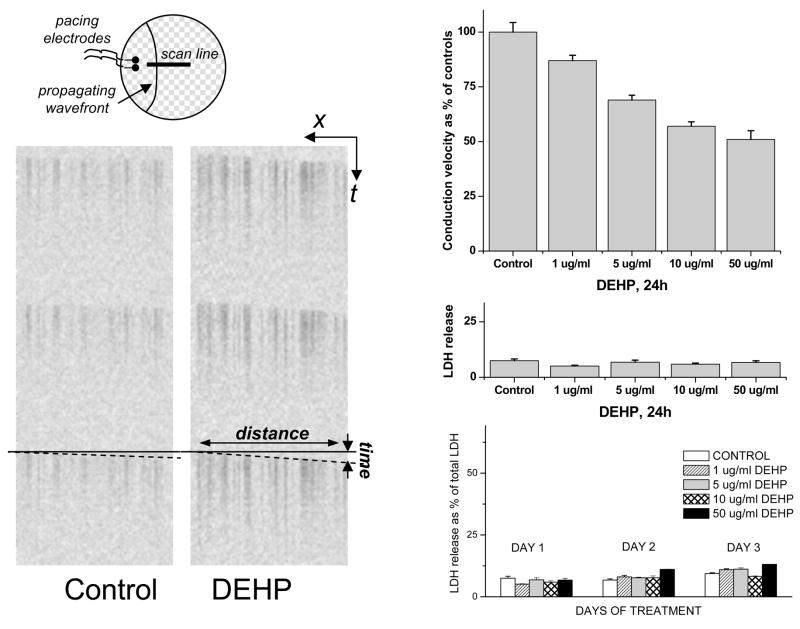
Fig. 3. Concentration-dependency of DEHP effect on conduction velocity and LDH release.
The top left cartoon shows the experimental setup for measuring conduction velocity. Representative linescan images of the control and 50μg/ml DEHP samples are shown below. The upper right graph shows concentration-dependent decrease in conduction velocity following 24h DEHP treatment. The corresponding values of LDH release can be found immediately below. With continuous exposure to DEHP, the conduction velocity continued to decrease, but the LDH release stayed comparable to the control samples (bottom right graph). A marked decrease in conduction velocity seen after 3 day of treatment with 50μg/ml DEHP is shown in the next figure.

