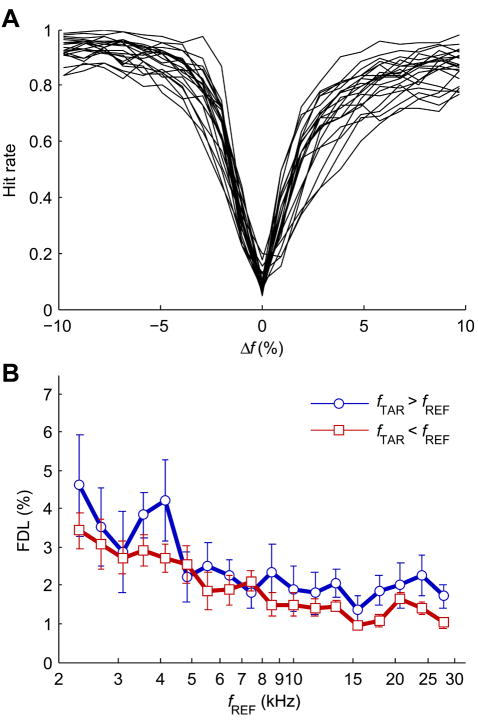
Fig. 3.
(A) Psychometric functions of hit rate for the tone-step task as a function of Δf for all subjects (N = 22) that completed tone-step testing, with hit rate combined across all reference frequencies. (B) Population mean tone-step FDLs for all upward (fTAR > fREF) and downward (fTAR < fREF) Δfs at each reference frequency. Error bars show 95% confidence intervals.

