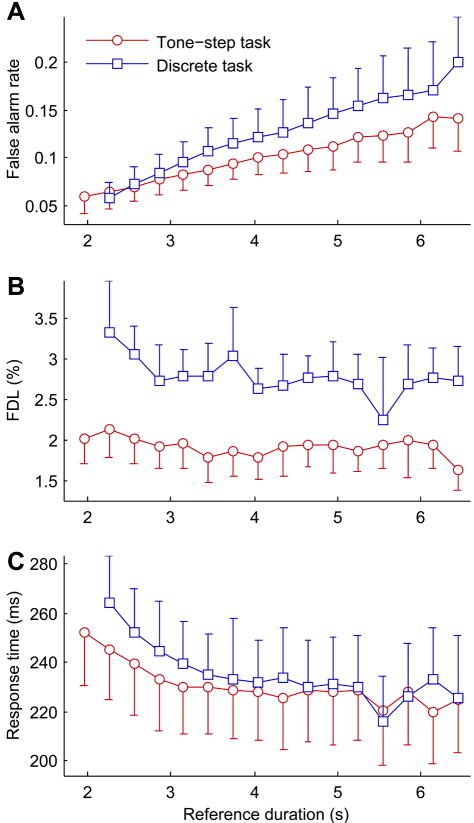
Fig. 8.
(A) False alarm rate, (B) overall population mean FDL, and (C) hit trial response time as a function of time held in the nosepoke, calculated for time bins of 300 ms from 1.8 to 6.9 seconds, for the tone-step task (circles) and the discrete tone task (squares). Error bars show 95% confidence intervals.

