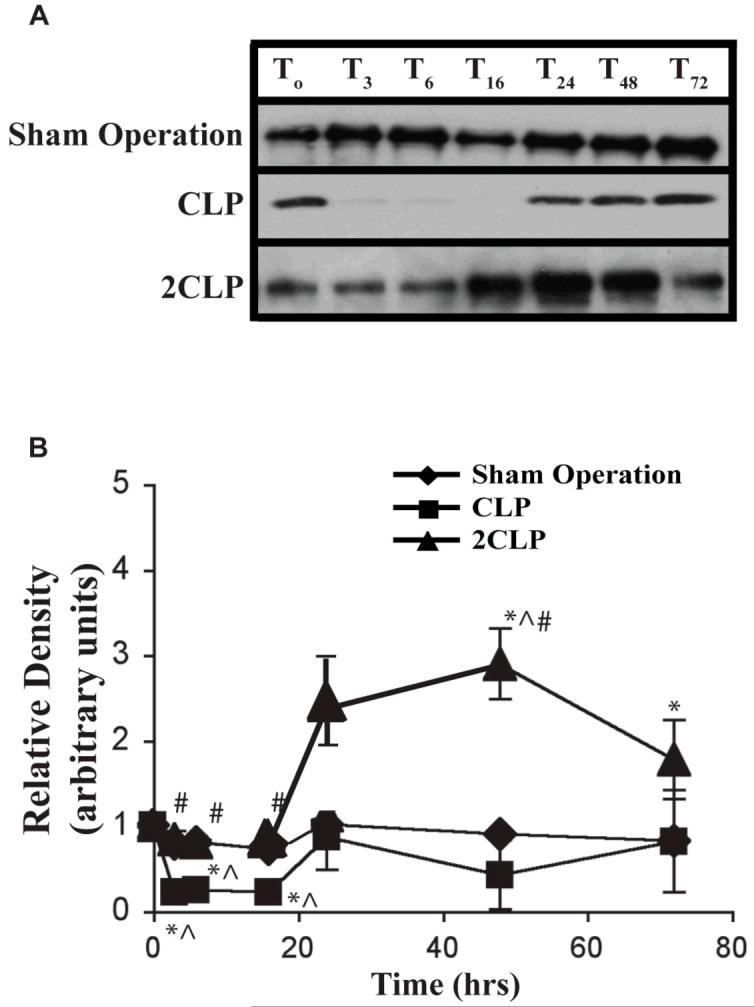
Figure 3. Cytoplasmic STAT-3 Abundance Following Sham Operation (Sham), Single Puncture CLP (CLP) and Double Puncture CLP (2CLP).

A: autoradiogram of representative immunoblot detailing relative abundance of cytoplasmic STAT-3 following Sham, CLP and 2CLP. B: quantification of densitometrically-determined relative abundance of cytoplasmic STAT-3 following intervention. Each data point represents ± SD of values from 3 different animals. Mean value at To set equal to unity; values at other time points normalized to this value. Time following intervention is shown on x-axis. * - value significantly different from To. ^ - value significantly different from value for Sham at same time point. # - value for 2CLP significantly different from value for CLP at same time point.
