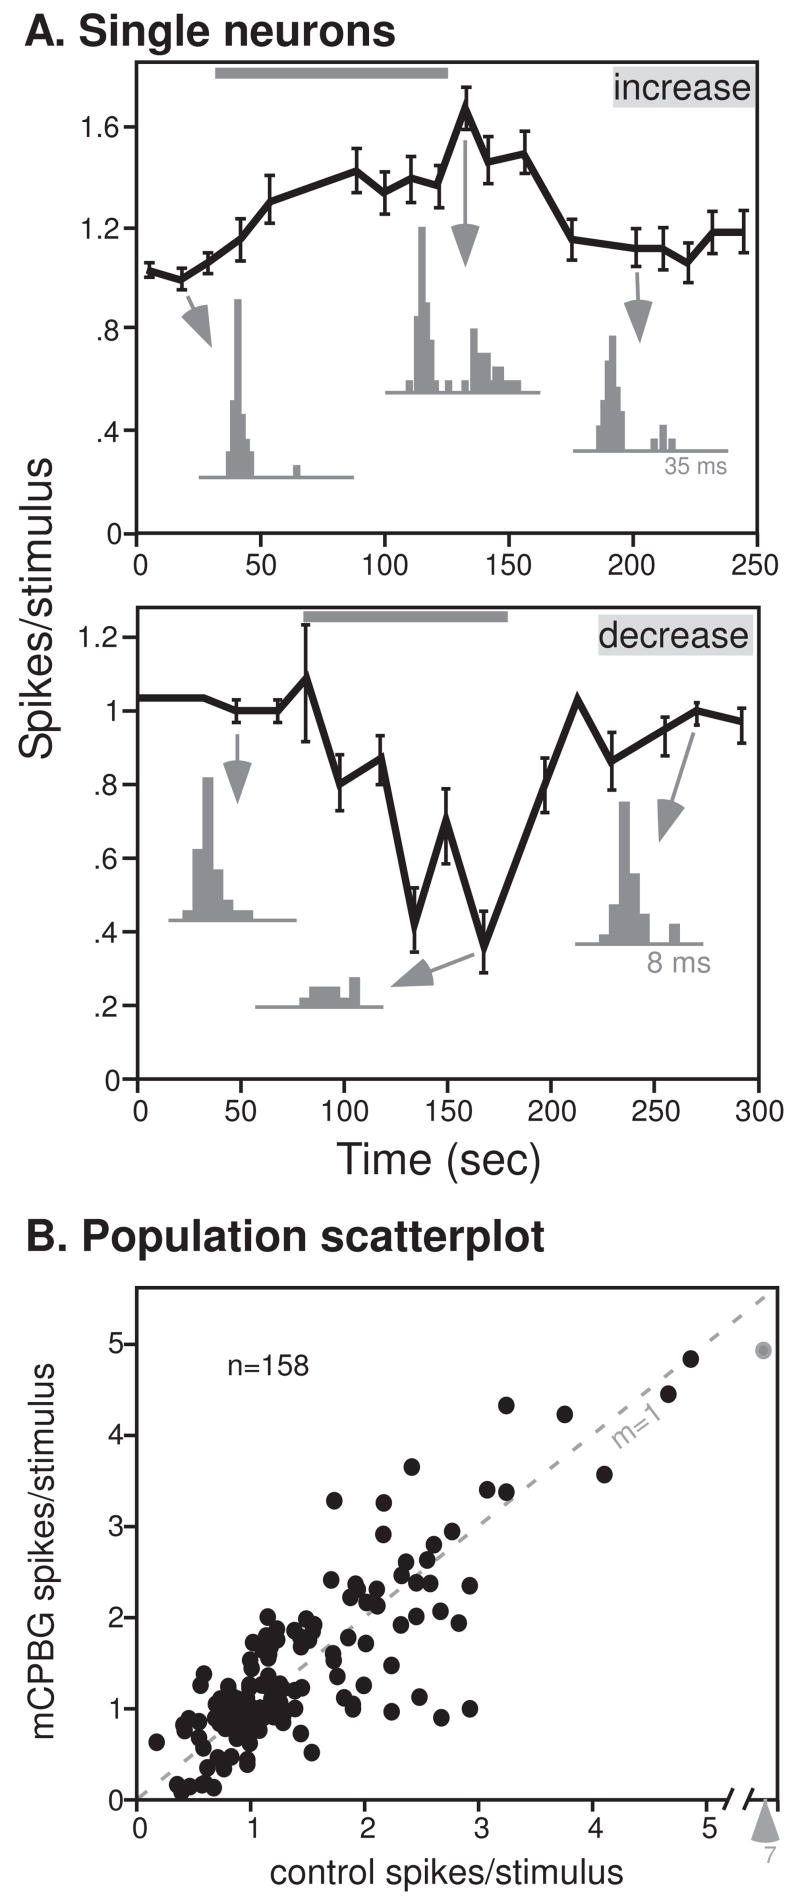
Figure 1.

5-HT3 activation has mixed effects. A. 5-HT3 application increases evoked responses for some neurons. Plot of the average spikes/stimulus (± s.e.m.) for a single neuron before, during, and after the application of mCPBG (gray bar). PSTHs are of the time points indicated by arrows. The stimulus evoking spikes consisted of an FM sweep with a center frequency of 23 kHz. B. 5-HT3 application decreases evoked responses for some neurons. The stimulus evoking spikes consisted of an FM sweep with a center frequency of 21 kHz. Conventions are as in Fig. 1A. C. Effects of 5-HT3 activation on 158 neurons, plotted as the total spike count in response to 32 stimulus presentations of FM sweeps (n = 86) or CF tones (n = 72) in the control versus during mCPBG application. The dashed line with a slope of 1 marks no change in spike count.
