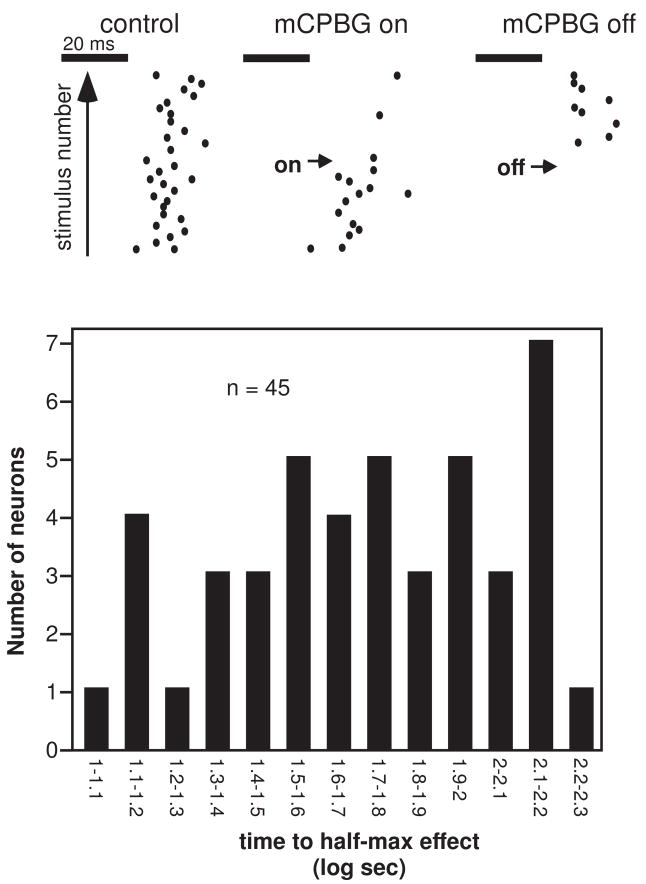
Figure 2.
Timecourse of effects of mCPBG. A. A single neuron exhibiting a rapid effect of mCPBG. Raster dots indicate individual spikes in response to single stimulus presentations, with sequential responses presented above each other. The stimulus consisted of a 10 kHz FM sweep with a center frequency of 28 kHz, presented at a rate of 4 Hz. B. Histogram of the time to the half-maximum effect of mCPBG on spike count for 45 neurons responding to mCPBG application with a change of 25% or greater in spike count.

