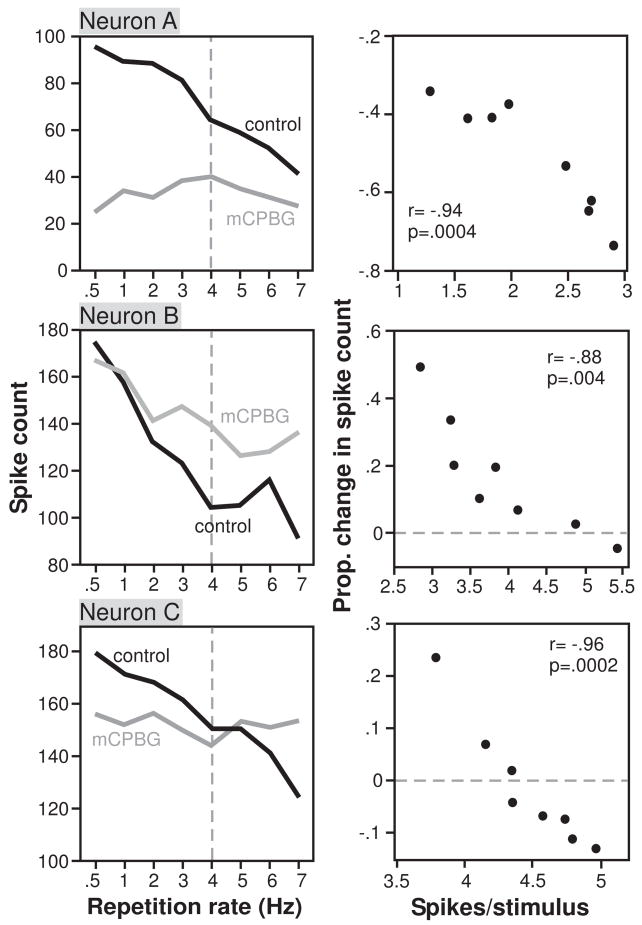
Figure 6.
Examples of 3 neurons for which the effects of mCPBG varied depending on the stimulus repetition rate. A. Left plot shows the total spike count for 32 stimulus repetitions, during the control and the application of mCPBG as a function of the stimulus repetition rate, in Hz. Right plot shows the proportional change in spike count evoked by mCPBG versus the average number of spikes per stimulus. The stimulus consisted of a 20 ms tone at 16 kHz. For this neuron, mCPBG decreased the response less at higher repetition rates, corresponding to lower spike rates. B. Similar plots for a second neuron using a stimulus consisting of a 20 ms tone at 12 kHz. For this neuron, mCPBG facilitated the response more at high repetition rates, corresponding to lower spike rates. C. Similar plots for a third neuron using a stimulus consisting of a 20 ms tone at 13 kHz. For this neuron, mCPBG suppressed the response at low repetition rates (high spike rates), and facilitated the response at high repetition rates (low spike rates).

