Figure 4.
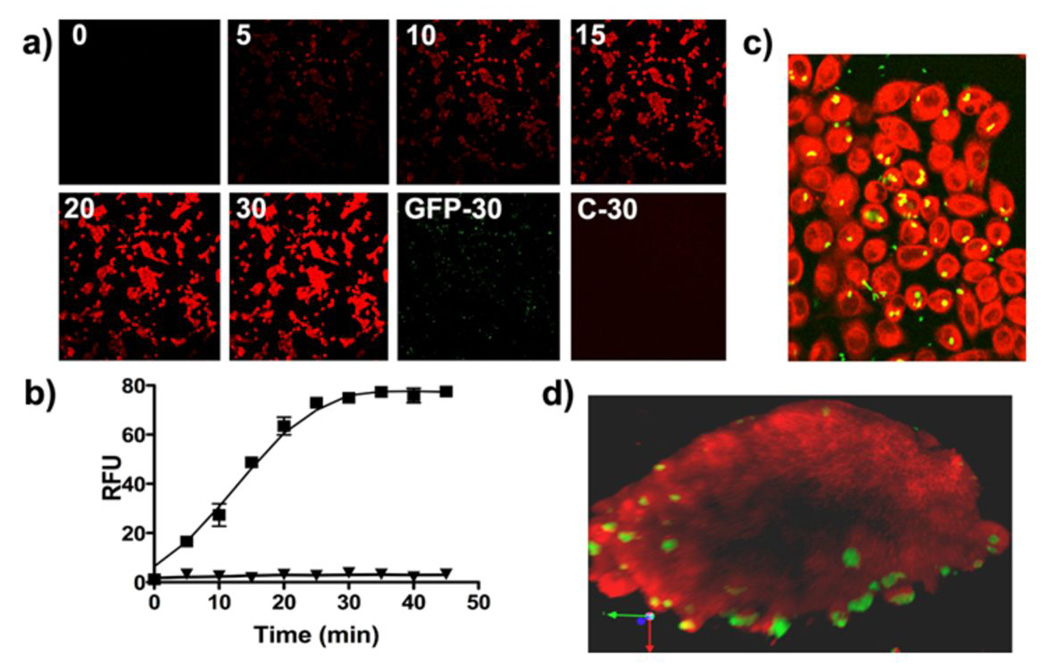
In vitro imaging of MCHB within JC cancer cells. (a) Kinetics of CNOB reduction as visualized by the generation of MCHB fluorescence in JC cells infected with GFP-expressing SL7838-chrR6 at MOI of 10/cell. Cells were imaged by confocal microscopy at the indicated times (minutes) after CNOB addition (4×magnification). See Materials and Methods for details. The ‘GFP-30’ panel shows GFP fluorescence from bacterial cells at 30 minutes from monolayers to which no CNOB was added. Panel ‘C-30’ represents a control plate of cells treated with CNOB, but not SL7838-chrR6, imaged 30 minutes after the addition of CNOB. (b) An equivalent experiment was run and CNOB conversion to MCHB was quantified at the indicated times following CNOB addition in a fluorescence plate reader for cells with or without CNOB addition (■ and ▲, respectively). (c) The experiment of Fig. 3a was repeated using an MOI of 1.0 CFU/cell, resulting in approximately 20% of cells becoming infected. The representative image shown was taken 30 minutes after CNOB addition (20×magnification). (d) JC cells were used to form multicellular tumor spheroids. SL7838-chrR6 expressing GFP was added at an MOI of approximately 1000 CFU/spheroid and incubated for 30 minutes to permit infection. Images were taken by 2-photon microscope 1 hour after CNOB addition. Z-stack images were reconstructed into a three-dimensional model using Velocity software and snapshots were taken from different angles. Note that the image represents a cross section through the center of the spheroid and 95 µm depth.

