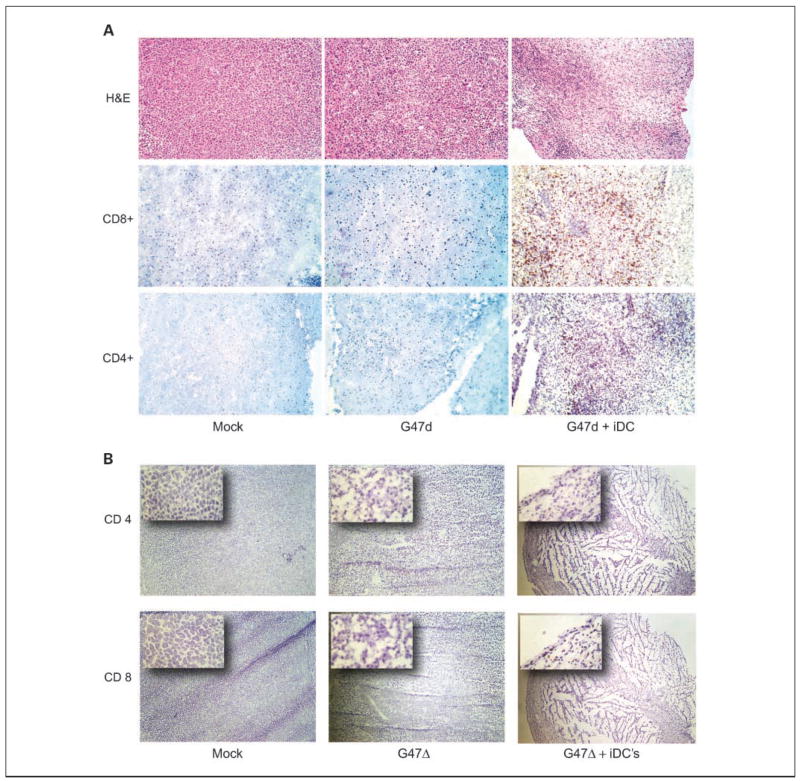
Fig. 2.
Lymphocytic infiltration of tumors. A, immunohistochemistry of representative N18 tumors from the indicated treatment groups. Combination-treated tumors show reduced cellularity and areas of necrosis on H&E (top) and increased CD4+ (bottom) and CD8+ (middle) T lymphocyte infiltration. B, low-magnification images (×4) show sheets of polygonal neuroblastoma cells in the mock-treated tumors, whereas cellularity is decreased somewhat in G47Δ-treated tumors. Combination-treated tumors were smaller at day15 (the entire lesion can be seen at this magnification) and centrally necrotic with a rim of viable tumor tissue infiltrated by CD4+ and CD8+ T lymphocytes as seen in the insets (×20).

