
Fig. 2.
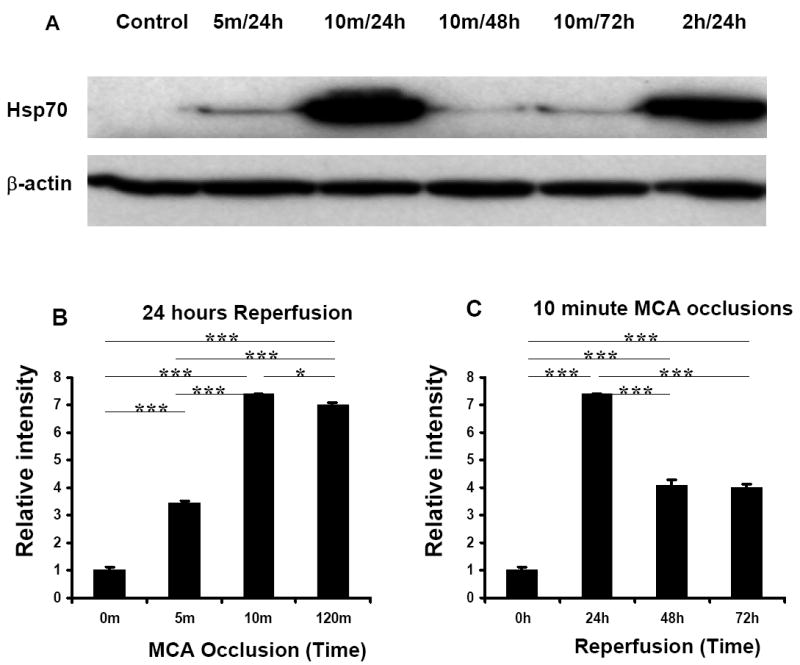
Western Blot Analysis of Hsp70 protein in brains following 5 minute, 10 minute, or 2h MCAO. β-actin served as a loading control. A. Hsp70 protein was induced following 5 minute, 10 minute, or 2h of focal ischemia. B. Relative Intensities (Y axis) of the Hsp70 protein bands following 5 minute, 10 minute, and 120 minute MCAO at 24h after ischemia compared to control. Note that the maximal induction of Hsp70 protein was following the 10 minute-MCAO relative to control. C. Relative Intensities (Y axis) of the Hsp70 protein bands following 10-minute MCAO after 0h, 24h, 48h, or 72h of reperfusion (X axis). Note that the maximal induction of Hsp70 protein was at 24h after 10 minute-MCAO. n=3 in all groups. *p<0.05; *** p<0.001.