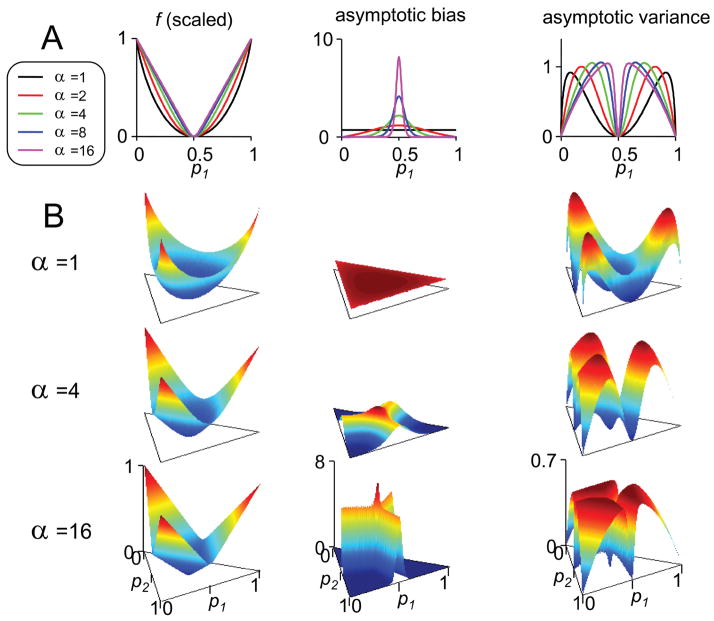
Figure 1.
Behavior of bias and variance of naive estimates of indices of concentration fα. (A) Two symbols, with probabilities p1 and p2 = 1 − p1. (B) Three symbols, with probabilities p1, p2, and p3 = 1 − p1 − p2. Column 1: fα, linearly rescaled into the range [0, 1]. Column 2: the coefficient of 1/N in the asymptotic bias (same normalization as column 1). Column 3: the coefficient of 1/N in the asymptotic variance (same normalization as column 1).

