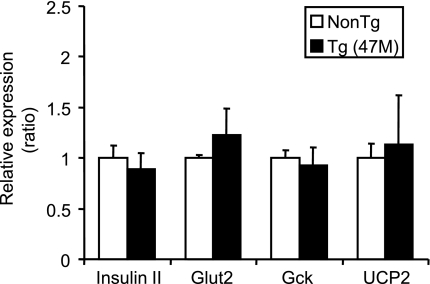
FIG. 6.
Gene expression profiles in islets from hGPR40 transgenic and nontransgenic mice. The hGPR40 transgenic (47M) and nontransgenic mice were fed on 60 kcal% fat diet for 9 weeks. In each group, the islets from more than three mice were collected, and mRNA levels of indicated genes were estimated by quantitative real-time PCR analyses in duplicate. mRNA levels of actin were used as an internal control. Ratios in hGPR40 transgenic mice were with respect to values in nontransgenic mice. All values are the means ± SE (n = 3–4). Gck; glucokinase; NonTg, nontransgenic; Tg, transgenic.

