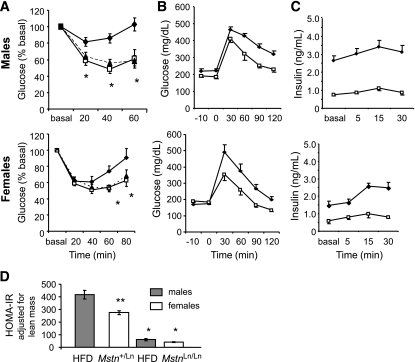
FIG. 4.
Insulin resistance was normalized in HFD-fed homozygous Mstn mutant animals to levels of standard diet–fed mice. A: Insulin tolerance test. B and C: Glucose tolerance test. ♦, HFD Mstn+/Ln; □, HFD MstnLn/Ln; ▴, standard diet MstnLn/Ln. HFD blood glucose was monitored during the glucose tolerance test (B) or insulin measured thereafter (C). Data are shown as means ± SE for males (n = 8) and females (n = 6). D: The HOMA-IR was calculated from the glucose tolerance data as described in research design and methods. Insulin resistance was adjusted for lean mass compared with male heterozygous mice. Level of insulin resistance was different at P < 0.01 compared with same sex Mstn+/Ln (*) or males Mstn+/Ln (**). Bars represent the means ± SE of insulin resistance calculated from AUCs.

