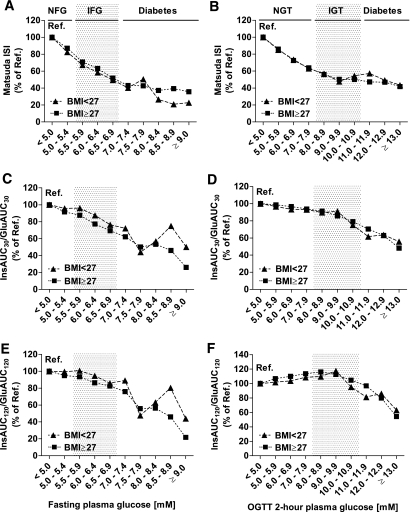
FIG. 3.
Insulin sensitivity (Matsuda ISI) (A and B), early-phase insulin release (InsAUC30/GluAUC30) (C and D), and total insulin release in an OGTT (InsAUC120/GluAUC120) (E and F) across the categories of FPG and 2-h PG in nonobese (BMI <27 kg/m2; ▲) and obese subjects (BMI ≥27 kg/m2; ■). Bars display insulin sensitivity or insulin release relative to the reference category (FPG <5.0 mmol/l, 2-h PG <5.0 mmol/l). Calculations were based on geometric means, adjusted for age and BMI, with the general linear model (performed separately in subgroups of nonobese and obese subjects). Cutoff values for different categories of FPG and 2-h PG are as explained in Fig. 1. Ref., reference.

