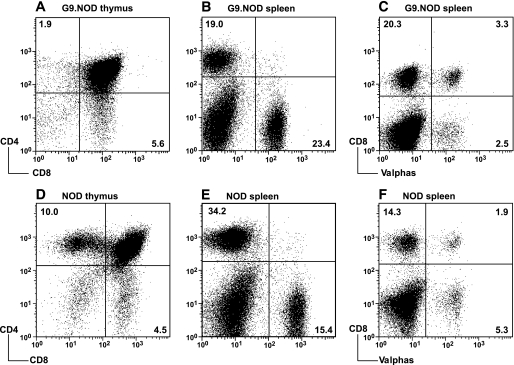
FIG. 1.
Comparison of thymocytes and splenocytes from G9NOD transgenic mice and nontransgenic NOD mice. A–C: Cells from G9NOD transgenic mice. D–F: Cells from nontransgenic NOD mice. A and D: Thymocytes single-positive CD4 and anti-CD8. B and E: Splenocytes stained with anti-CD4 and anti-CD8. C and F: Splenocytes stained with anti-CD8 and a pool of anti-Vα2, -3, -8, and -11. The results are representative of 15 transgenic mice in more than five independent experiments. The mean (SD) values for the cell populations are as follows: A: CD4 3.46 (1.71); CD8 5.89 (2.28). B: CD4 17.38 (4.91); CD8 20.35 (3.77). C: CD8Vα2, -3, -8, -11 negative 20.0 (4.1); CD8Vα2, -3, -8, -11 positive 3.8 (1.9). D: CD4 10.2 (1.9); CD8 4.7 (0.7). E: CD4 40.63 (5.6); CD8 17.07(1.9). F: CD8Vα2, -3, -8, -11 negative 15.36 (1.03); CD8Vα2, -3, -8, -11 positive 1.85 (0.08).

