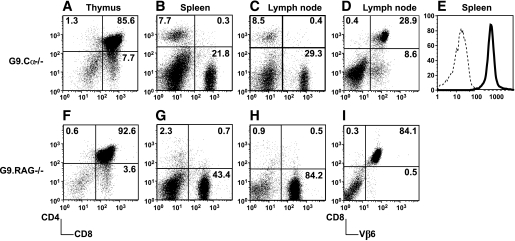
FIG. 2.
Phenotype of G9Cα−/−.NOD mice and G9RAG−/−.NOD mice. G9Cα−/−.NOD thymocytes (A), splenocytes (B), and PLN cells (C) were stained with anti-CD4 and -CD8. D: PLN cells were stained with anti-Vβ6 and CD8. E: Gated CD8 T-cells were stained with Kd-B15-23 (bold line) and control Kd-LLO 91–99 (dotted line) tetramer, respectively. G9RAG−/−.NOD thymocytes (F), splenocytes (G), and PLN cells (H) were stained with anti-CD4 and -CD8. I: PLN cells were stained with anti-Vβ6 and CD8. The results represent three independent experiments. The mean (SD) values for the distribution of cell populations are as follows: A: CD4 1.43 (0.42); CD8 5.1 (1.6). B: CD4 8.28 (1.35); CD8 21.14 (4.62). C: CD4 6.28 (0.57); CD8 52.18 (9.26). F: CD4 0.85 (0.44); CD8 2.93 (1.22). G: CD4 2.21 (2.16); CD8 33.42 (6.94). H: CD4 1.18 (0.66); CD8 68.7 (13.32).

