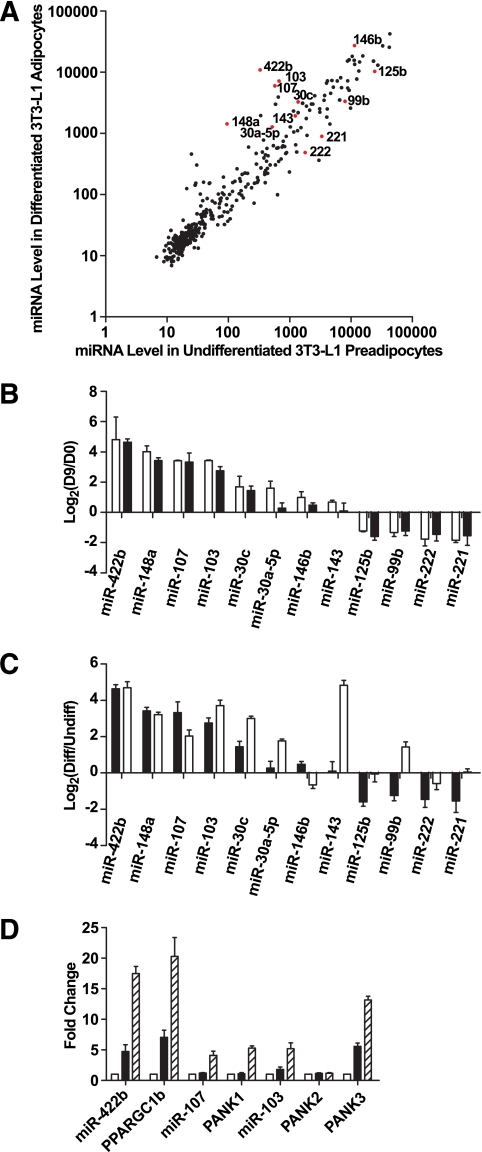
FIG. 1.
miRNA expression profiling during 3T3-L1 adipogenesis. A: Intensity scatter plot showing comparison of miRNA profiles between undifferentiated 3T3-L1 preadipocytes (day 0) and differentiated 3T3-L1 adipocytes (day 9). The 12 miRNAs that are the focus of our detailed analyses are highlighted in red and indicated by a label. B: Validation of miRNA array results for 12 regulated miRNAs by RT-PCR assays. Expressions for all miRNAs are plotted as fold-change in log2 scale; positive indicates enriched in day 9 vs. day 0. □, Array result (n = 2); ■, RT-PCR result (n = 4). Data are expressed as means ± SE. C: Comparison by RT-PCR of miRNA regulation during 3T3-L1 differentiation and primary fat cell development. Expressions of all miRNAs are normalized to internal control and plotted as fold-change in log2 scale. ■, day 9 vs. day 0, same data as Fig. 1B (n = 4); □, mature adipocytes vs. enriched preadipocytes (n = 4). Data are expressed as mean ± SE. D: Intronic miRNAs and their host genes are co-regulated during adipogenesis. miR-422b is in the intron of PPARGC1b; miR-107 is in the intron of PANK1; the two copies of miR-103 are in the introns of PANK2 and PANK3. miRNA expression levels are measured by RT-PCR and normalized to internal control. Expression levels of mRNAs are also determined by RT-PCR and normalized to internal control. Expressions are shown as fold-change relative to the level at day 0. □, day 0; ■, day 2; ▨, day 4. Data are expressed as mean ± SE (n = 3).

