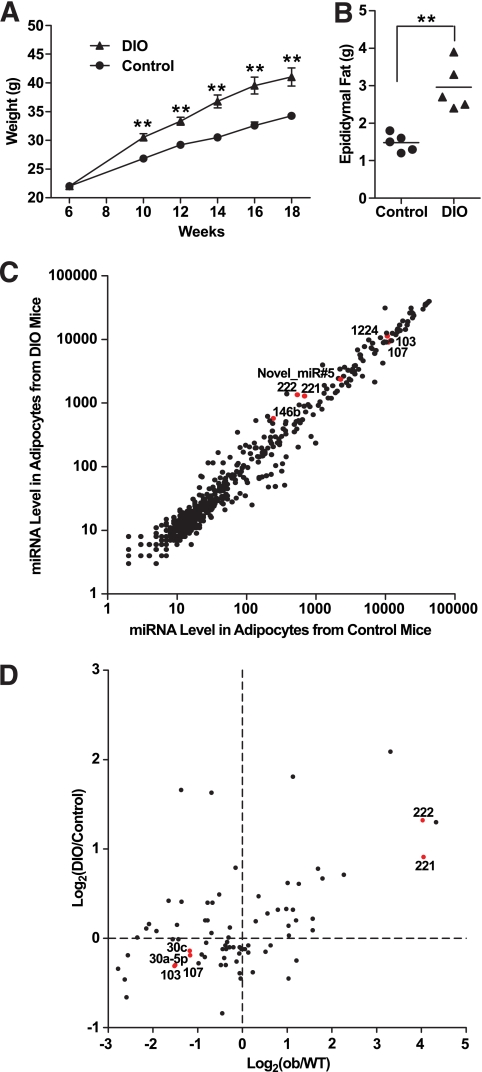
FIG. 3.
miRNA expression profiling in adipocytes from control and DIO mice. A: Weight of control and DIO mice (n = 5). DIO mice were fed with a 55% high-fat diet starting from week 6 to week 18. Controls were fed with a normal diet. Data are expressed as means ± SE. **P < 0.01. B: Weight of epididymal fat pads from control and DIO mice (n = 5) at week 18. **P < 0.01. C: Intensity scatter plot showing comparison of miRNA profiles in adipocytes from control and DIO mice. Mirtron miR-1224, Novel_miR#5 (novel miRNA cloned from bovine adipose tissue described in the text), and some miRNAs used in our detailed analyses are highlighted in red and indicated by a label. D: Scatter plot showing the positive correlation of miRNA regulation in two disease models for obesity: ob/ob and DIO mice. A total of 78 miRNAs, whose levels are above the mean expression of all miRNAs in at least one of the four samples (enriched adipocytes from wild-type [WT], ob/ob, control, and DIO mice), are shown. Fold-changes are based on array results and plotted in a log2 scale. Some miRNAs used in our detailed analyses are highlighted in red and indicated by a label. Pearson's correlation coefficient: r = 0.51, P < 0.0001.

