FIG. 6.
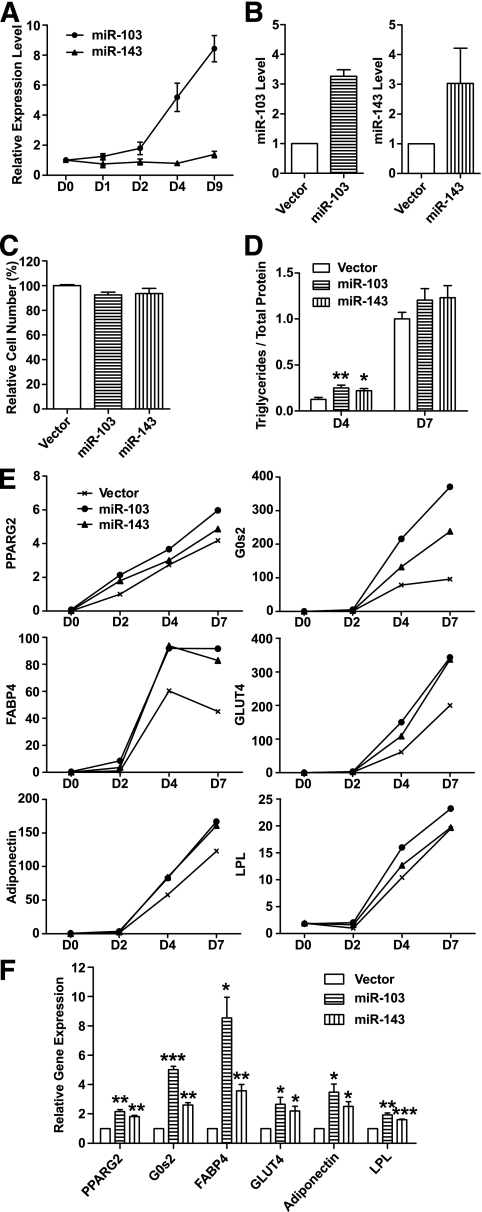
Ectopic expression of two adipocyte-induced miRNAs, miR-103 or miR-143, accelerates adipogenesis. A: miR-103 and miR-143 are induced during 3T3-L1 adipogenesis. miRNA expression levels are measured by RT-PCR, normalized to internal control and plotted relative to their respective levels in preadipocyte (day 0). Data are expressed as mean ± SE (n = 3). B: Expression level of miR-103 or miR-143 in infected and sorted cells compared with vector control. Data are expressed as mean ± SE (n = 3). C: Ectopic expression of miR-103 or miR-143 has little effect on 3T3-L1 cell growth by MTT assay. Data are expressed as mean ± SE (n = 6). D: Ectopic expression of miR-103 or miR-143 increases triglyceride accumulation at day 4 (D4) but not day 7 (D7). Triglycerides are normalized to total protein and plotted relative to the level of the control cells expressing vector alone at D7. Data are expressed as mean ± SE (n = 6). **P < 0.01, *P < 0.05. E: Ectopic expression of miR-103 or miR-143 hastens expression of adipogenic markers at an early stage (days 2 and 4) of adipogenesis. mRNA levels are measured by RT-PCR, normalized to internal control and plotted relative to their respective levels at day 2 (D2). Data are expressed as mean only (n = 3). PPARG2, peroxisome proliferator-activated receptor γ 2; G0s2, G0/G1 switch 2; FABP4, fatty acid binding protein 4; GLUT4, glucose transporter 4; LPL, lipoprotein lipase. F: Ectopic expression of miR-103 or miR-143 hastens expression of adipogenic markers at day 2 (D2). Data are expressed as mean ± SE (n = 4). ***P < 0.001, **P < 0.01, *P < 0.05 by one-sample Student's t test.

