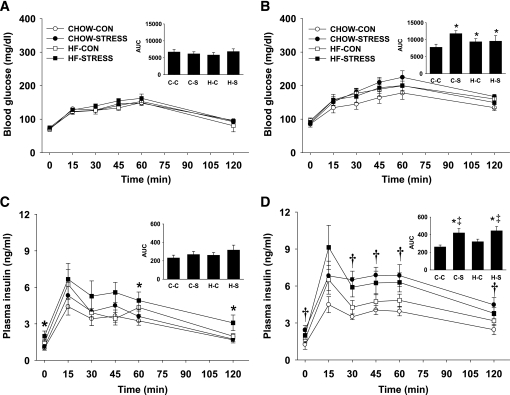
FIG. 5.
A–D: Glucose tolerance test in males on postnatal day 70. Blood glucose (A and B) and plasma insulin (C and D) were determined for 2 h after oral administration of glucose for male offspring weaned onto standard chow (A and C) or high-fat diet (B and D). Males weaned on standard chow are: standard chow–control (CHOW-CON; n = 6), standard chow–stress (CHOW-STRESS; n = 4), high-fat–control (HF-CON; n = 4), and high-fat–stress (HF-STRESS; n = 4). Males weaned on high-fat are: standard chow–control (n = 4), standard chow–stress (n = 4), high-fat–control (n = 5), and high-fat–stress (n = 4). *High-fat diet main effect, P < 0.05; †stress main effect, P < 0.05; ‡high-fat diet and stress interaction, P < 0.05. A–D Insets: The integrated AUC was determined for glucose and insulin using the trapezoidal method. *P < 0.05 vs. corresponding standard chow–weaned group; †P < 0.05 vs. standard chow–control and standard chow–stress groups; ‡P < 0.05 vs. standard chow–control and high-fat–control groups. C-C, standard chow–control; C-S, standard chow–stress; H-C, high-fat–control; H-S, high-fat–stress.

