
Figure 1.
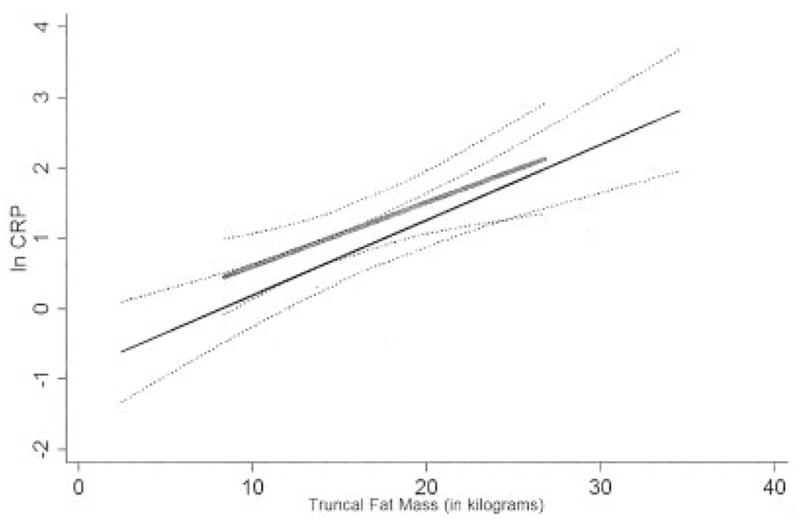
Least squares linear regression analysis of the interaction of the levels of swollen plus tender joints in the relationship between the logarithmically transformed C-reactive protein level (ln CRP) and truncal fat in women with rheumatoid arthritis. Broken lines indicate the 95% confidence intervals of the estimates. Female subjects are divided according to the level of swollen plus tender joints, with “high” articular activity (thin solid line) and “low” articular activity (thick shaded line) defined as a swollen plus tender joint count of ≥16 and <16, respectively. The P value for interaction of high articular activity (versus low articular activity) in the log CRP–truncal fat relationship was 0.686.