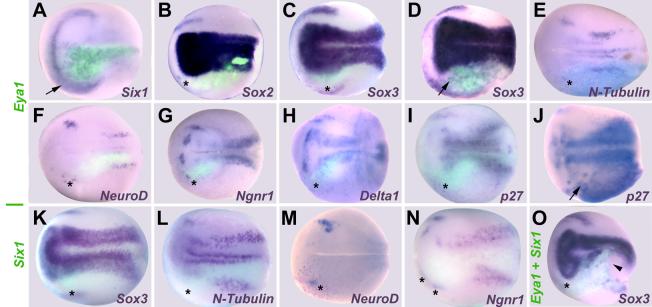
Fig. 3.
Effects of Eya1 and Six1 overexpression on markers of neurogenesis and placodal ectoderm at neural plate stages. Embryos after unilateral injection (lower half) of Eya1 (A-J), Six1 (K-N) or Eya1+Six1 (O) mRNA. In all cases, where myc-GFP was coinjected as lineage tracer (A-D, F-I, K, L, N, O), embryos are shown superimposed with green fluorescent channel. Black asterisks indicate reductions in the placodal or non-neural ectoderm. Arrows mark increased or ectopic marker gene expression in the placodal or non-neural ectoderm; black arrowhead identifies deformed blastopore due to gastrulation defects (O). For Sox3 (C,D) and p27Xic1 (I,J) after Eya1 injections two different phenotypes are depicted.

