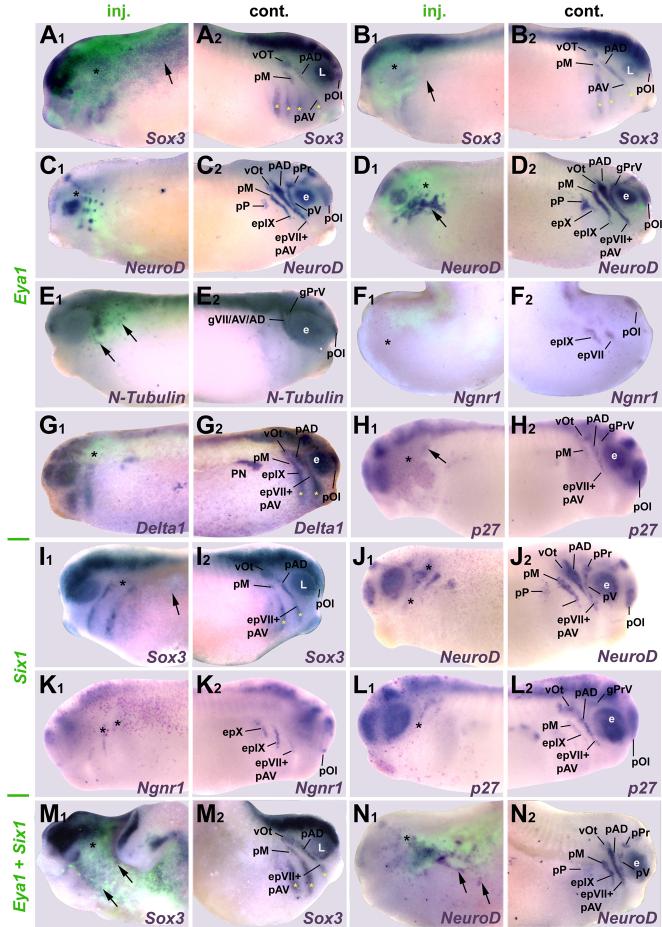
Fig. 4.
Effects of Eya1, Six1 and Eya1+Six1 overexpression on various neurogenesis markers at tail bud stages (stage 26). Injected (A1-N1) and control (A2-N2) sides of tail bud stage embryos after unilateral injection of Eya1 (A-H), Six1 (I-L) or Eya1+Six1 (M, N) mRNAs. In all cases, where myc-GFP was coinjected as lineage tracer (A-G, M-N), embryos are shown superimposed with green fluorescent channel. Black asterisks indicate reductions, while black arrows mark increased or ectopic marker gene expression in the placodal or non-neural ectoderm. Yellow asterisks identify expression in pharyngeal pouches. For Sox3 (A, B) and NeuroD (C, D) after Eya1 injections two different phenotypes are depicted. Abbreviations as in Fig. 2. gPrV: profundal-trigeminal ganglionic complex; L: lens placode; PN: pronephros.

