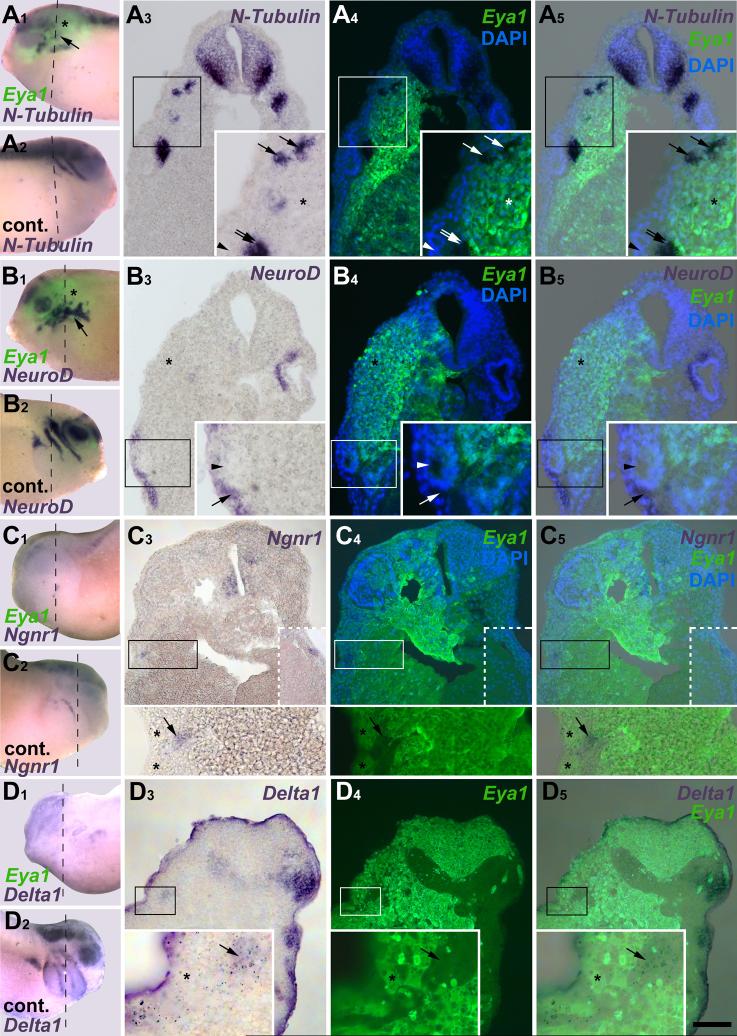
Fig. 7.
Dose-dependent effects of Eya1 on neurogenesis markers as revealed in tissue sections. Distribution of N-Tubulin (A), NeuroD (B), Ngnr1 (C) and Delta1 (D) in stage 26 embryos after injection of myc-Eya1 or co-injection of Eya1 with myc-GFP mRNA. Embryos are shown as wholemounts (injected side: A1-D1; control side: A2-D2) and in transverse sections (at level indicated by black line) shown in bright field (A3-D3), superimposition of green (myc-immunostaining) and blue (DAPI) fluorescence (A4-D4, no DAPI image available in D), and as a merged image (A5-D5). Boxed areas are magnified in inserts. The DAPI channel is not shown in the inserts of C to make Ngnr1 staining more clearly visible. Hatched boxed area in C3-C5 shows Ngnr1 positive epibranchial placode on control side in an adjacent section. Asterisks indicate reductions, while arrows mark ectopic marker gene expression in the placodal or non-neural ectoderm. Double arrows identify areas of residual expression. Arrowheads mark displaced otic vesicle on injected side. Bar in D5: 100 μm (for A3-5-D3-5).

