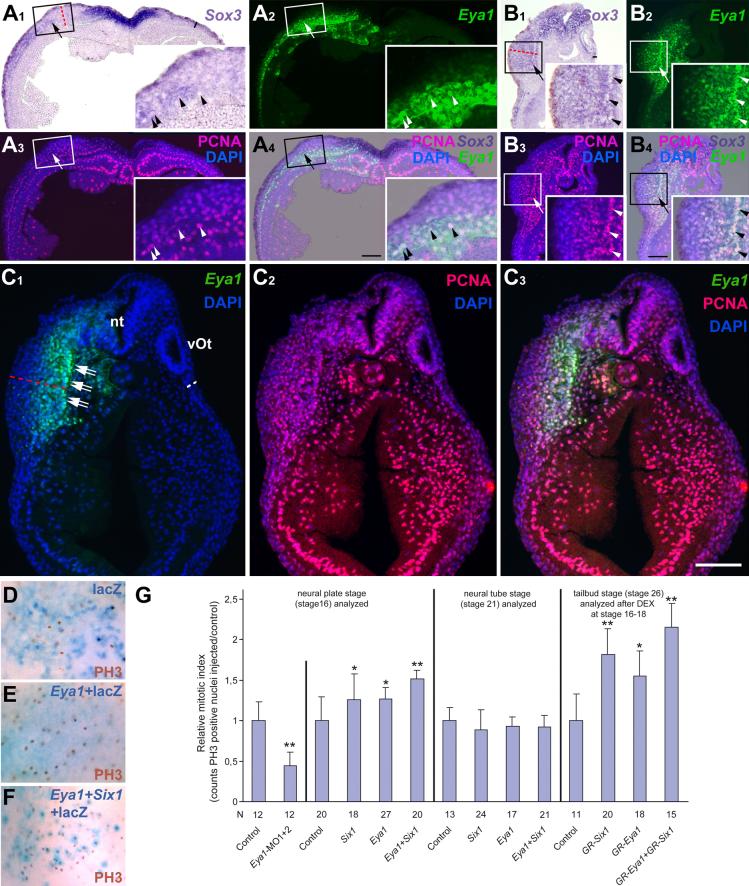
Fig. 9.
Eya1 and Six1 promote proliferative SoxB1-positive neuronal progenitors. A-C: Transverse sections through neural plate (A) or tail bud stage (B, C) embryos that received unilateral myc-Eya1 mRNA injection at the two cell stage. A, B: Panels show Sox3 expression in bright field (A1-B1), distribution of injected myc-Eya1 protein (A2-B2), PCNA together with DAPI staining (A3-B3) and a merged image (A4-B4). C: Panels show distribution of injected myc-Eya1 protein (C1), PCNA (C2) and a merged image (C3) together with DAPI staining. Ectoderm that received high levels of Eya1 expresses Sox3 (A1-B1, arrows), is drastically thickened (A1-C1, red lines) compared to control side (black or white lines) and consists of multiple layers of PCNA positive cells (A3, B3, C2). The otic vesicle has failed to form on the injected side of embryos in B and C. Arrowheads identify cells coexpressing myc-Eya1 and PCNA. Double arrows in C identify the basal lamina of the ectoderm on the injected side. Abbreviations: nt: neural tube. vOt: otic vesicle. All bars: 100 μm. D-G: Effects of Eya1 and Six1 gain and loss of function on phosphohistone H3 (PH3). D-F: PH3 immunopositive nuclei in placodal ectoderm of neural plate stage embryos after injection of lacZ (D) Eya1 + lacZ (E) or Eya1 + Six1 + lacZ mRNAs (F). G: Relative mitotic index after injections of Six1 or Eya1 mRNAs or morpholinos. Standard deviations and significant increases are indicated (t-Test; *: p< 0.05, **: p< 0.001).

