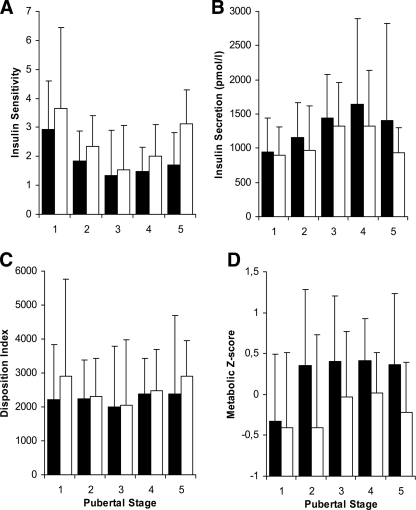
Figure 1.
Insulin sensitivity (A), insulin secretion (B), disposition index (C), and metabolic Z score (D) during puberty based on OGTTs in healthy children and adolescents. For each pubertal stage, the effect of low versus high SHBG levels is illustrated by grouping all children according to the median SHBG level for pubertal stage and sex. ■, below median SHBG group; □, above median SHBG group. The whiskers represent the 90th percentiles. Insulin sensitivity (WBISI) (ref. 13) and insulin secretion (first-phase release) (ref. 14) were calculated using glucose in millimoles per liter and insulin in picomoles per liter concentrations. To convert WBISI to glucose in milligrams per deciliter and insulin in microunits per milliliter, multiply by a factor 3. To convert insulin secretion from picomoles per liter to microunits per milliliter, divide by a factor 6. Disposition index was calculated as the product of insulin sensitivity and insulin secretion. The metabolic Z score is generated by combining Z scores from fasting glucose, triglyceride levels, inverse HDL cholesterol levels, waist circumference, and mean blood pressure levels divided by 5. An increase in the combined Z score indicates an increase in metabolic risk.

