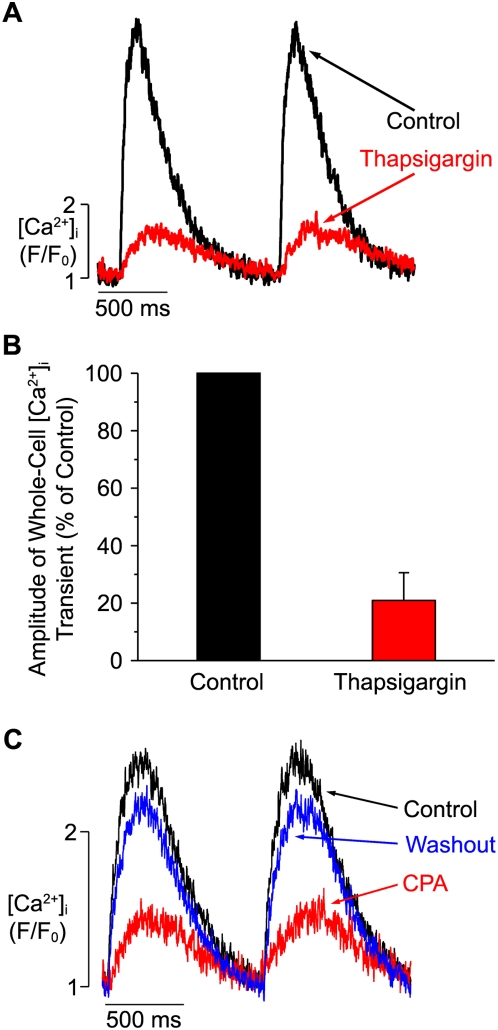
Figure 2. Thapsigargin decreases [Ca2+]i transients in hESC-CMs.
A. Time-course of field-stimulated [Ca2+]i transients in a representative hESC-CM under control conditions (black trace) and after exposure to thapsigargin (1 µM, red). B. Bar graph describing the percentage change in the peak of the [Ca2+]i transient before (control, black) and after (red) exposure to thapsigargin in hESC-CMs. C. Time-course of field-stimulated [Ca2+]i transients in a representative hESC-CM under control conditions (black), during exposure to 10 µM cyclopiazonic acid (CPA, red), and following washout of CPA (blue).

