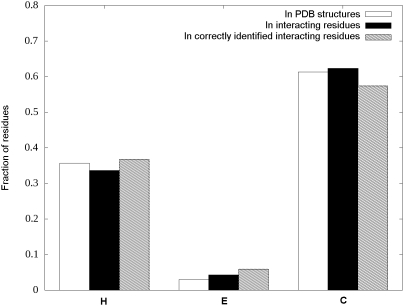
Figure 4. Secondary structure distributions in the short disordered binding site dataset.
Fraction of amino acids in different secondary structures in the disordered chains of the complexes. The three groups denote the fractions calculated on all the residues in the PDB structures, only the interacting ones and the ones correctly identified by the predictor.

