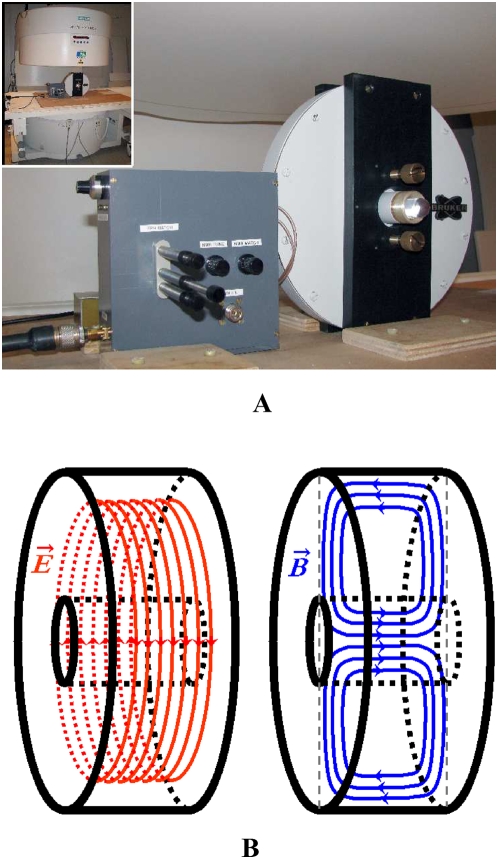
Figure 6. The OMRI experimental setup.
(A) the EPR cavity in the 0.2 T imaging system. (B) Simulation of the electric field E (red) and the magnetic field B (blue) in the resonant EPR cavity in TE011 mode. The electric field is concentrated outside the sample housing (black inner cylinder) while the magnetic field is centered on the sample.

