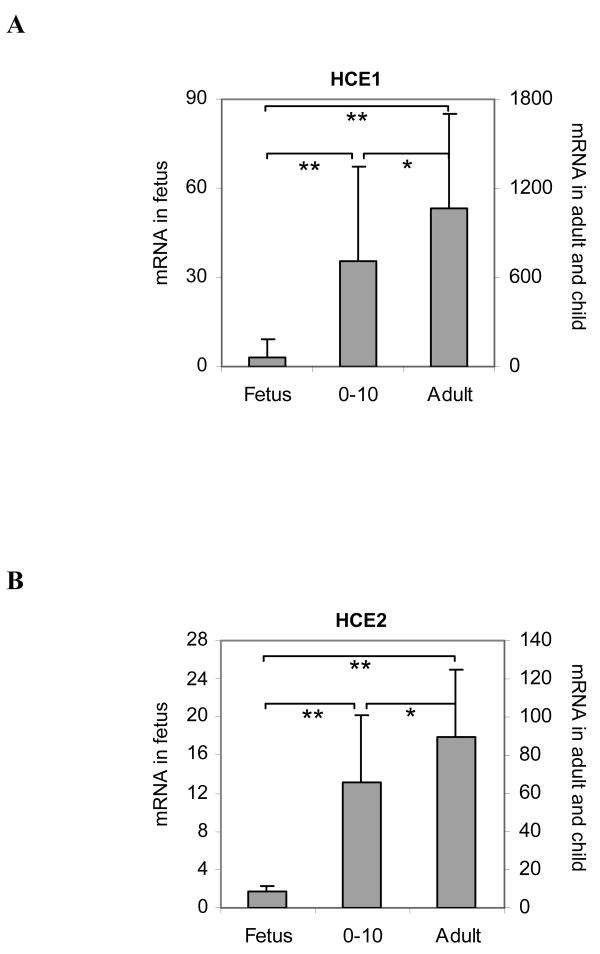
Fig. 1. Levels of HCE1 and HCE 2 mRNA in the adult, child and fetal groups.
Total RNAs were subjected to RT-qPCR analysis for the level of HCE1 mRNA (A) and HCE2 mRNA (B) by Taqman probes as described in the section of Materials and Methods. The adult group contained 22 samples, the child group contained 34 samples and the fetal group contained 48 samples. The signals from each target were normalized based on the signal from PolII and expressed as relative levels among all samples. The data are presented as mean ± SD *Statistical significance at p < 0.05, **Statistical significance at p < 0.001.

